ill
Superstar
which platform do you use for the tech analysis charts ?
You can literally use any. Almost all platforms have tech analysis. The key is finding out which metrics matter.
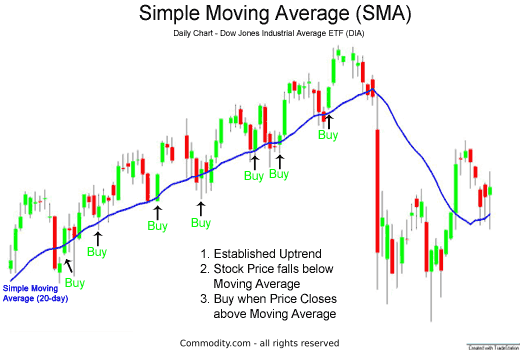
For instance, if you are a short-term swing trader, you're going to look at the daily charts, the 5min charts, and your tech analysis will be based off weekly and 20 day simple moving averages and where your stock is in relation to that line.
If you're a long term trader, you're going to look at the monthly and yearly charts, etc. You would use the 200-day moving average now instead of the short term 20 day ones.
Thats a very simplistic view but thats how you start to look at it.

So in this example, the blue line is the 20-day moving average. It is basically a "support" line for the stock meaning at the blue line, people are willing to hold the line and buy up stock. So every time the stock drops and touches the blue line, people buy it and it bounces back (in most cases). Now, this situation "holds the line" for a while. That means the support is fairly strong. However, you see that towards the end, it drops significantly. So while the blue line provides support, if it FAILS, then the drop is significant because now it has no level of "support" as we blew past the blue moving average line. Same works for the opposite scenario. If we were below the line and then it broke up above it, its called a "break out" and now the stock has plenty of room to run and gain upwards since theres no "ceiling" to it on the tech charts.
 I look again and it's IEX which is a company called Idex. The IDEX stock is completely different. I've never gone from
  to
to  so quick in my life.
