Boiler Room: The Official Stock Market Discussion

TigerLord

Rookie
Joined
May 29, 2012
Messages
145
Reputation
110
Daps
246
Reppin
NULL
I've been killing myself lately with so much lost money from these Chinese stocks.

Saw QUNR pull back to $29.49 and bought ahead of earnings report. Tanked to $24.77 and averaged down with a ton of shares. Was afraid at how much I put in, so sold at $25 something and took a few hundred bucks. Saw an upward trend, so bought back at $25 and sold at $26.50 (including my $29.49 shares) after a major firm set a $22 price target, thinking it was surely headed down. Lost a couple hundred. Up towards $28 today. I'm sure it's only a matter of time though before short sellers hit another Chinese company with book cooking allegations and tank it.

:lolbron:

Was doing research on Chinese stocks some time back. Came across this article: http://seekingalpha.com/article/468691-pwc-zhong-tian-a-chinese-auditor-with-a-flawless-record

I know there has been alot more recent discussions on the auditing of Chinese companies. So take it for what it is.
 

TigerLord

Rookie
Joined
May 29, 2012
Messages
145
Reputation
110
Daps
246
Reppin
NULL
Thanks for sharing. I have read many articles like this. Most of it is propaganda. They have hidden agendas when they purposefully spread misinformation like this. It's good storytelling, but far from factual. I think it's more productive to expound on the numerous complex order types and predatory HFT than it is to sit and whine that NYSE specialisits and CME Pit Traders are no more.

Any good reads you've come across that you wouldn't mind sharing?
 

TigerLord

Rookie
Joined
May 29, 2012
Messages
145
Reputation
110
Daps
246
Reppin
NULL
Have a question about volume. I notice often at the end of the day I see very high volume going through. When I say end of the day I mean the last 60 seconds of the trading day. Often even in the last few seconds. Hoping someone can give some insight on why that happens.
 

ill

Superstar
Joined
May 2, 2012
Messages
10,234
Reputation
432
Daps
17,295
Reppin
Mother Russia & Greater Israel
Have a question about volume. I notice often at the end of the day I see very high volume going through. When I say end of the day I mean the last 60 seconds of the trading day. Often even in the last few seconds. Hoping someone can give some insight on why that happens.

Day traders close out their positions at the end of the day to lock in profits.
 

GoogleMe

$ ¥ € £ $
Joined
Apr 21, 2013
Messages
2,171
Reputation
410
Daps
3,385
Reppin
The Street
Any good reads you've come across that you wouldn't mind sharing?

On HFT?

Have a question about volume. I notice often at the end of the day I see very high volume going through. When I say end of the day I mean the last 60 seconds of the trading day. Often even in the last few seconds. Hoping someone can give some insight on why that happens.

Can you provide an example?
 

GoogleMe

$ ¥ € £ $
Joined
Apr 21, 2013
Messages
2,171
Reputation
410
Daps
3,385
Reppin
The Street
so what do you suggest I look for? I was basically looking to see if there was growth each Q

Often a Company will beat earnings/revenue estimates and still trade lower, or miss estimates and trade higher. This is because all industries are unique, and each Company/Industry has various metrics that are used for analyzing earnings health. Margins tend to be important across most industries, and margins must be at least stable, while expanding margins are always a +. It is important to know the Company's business, where it generates revenues (geographical and business segment breakdowns), and who the Company sells to, and the health of these end user's industry. Also, you should take into account Company/industry-specific metrics. E.g. Cost-Per-Click; breakdowns of iPad, iPhone, iPod sales, Net Subscriber Growth at T-Mobile DirecTv, and others; or same-store-sales and inventory trends at Retailers. Also, announcements such as buybacks and dividends which can often offset a poor earnings report. Also, forward earnings guidance for the next quarter or fiscal year usually holds more weight than the actual quarterly results, as markets are forward-looking. The standard metrics to look at are P/E, P/S, PEG, P/B, P/FCF, EV/EBITDA, EPS/Revenue Growth, Margin Trends, and Debt/Equity.
 
Last edited:

TigerLord

Rookie
Joined
May 29, 2012
Messages
145
Reputation
110
Daps
246
Reppin
NULL

Yes

Can you provide an example?

Ok, for example when I go to the NASDAq site and look up TTWO Real-Time Quotes it shows me the last 5 Real-Time Quotes.

NLS Time NLS Price NLS Share Volume

16:00:02 $16.64 33,086
16:00:02 $16.64 4,200
16:00:02 $16.64 5
16:00:02 $16.64 100
16:00:02 $16.64 1,596

Usually during the day I'll see blocks of 100-500. Sometimes more. But then at the end of the day I'll see these huge numbers going through

I've noticed this on many different stocks. What III said "Day traders locking in profits" make sense. It doesnt really seem to effect the price but I was just curious because compared to the rest of the day those numbers jump out at me. Also it's after 4pm?
 

GoogleMe

$ ¥ € £ $
Joined
Apr 21, 2013
Messages
2,171
Reputation
410
Daps
3,385
Reppin
The Street
Yes


Ok, for example when I go to the NASDAq site and look up TTWO Real-Time Quotes it shows me the last 5 Real-Time Quotes.

NLS Time NLS Price NLS Share Volume

16:00:02 $16.64 33,086
16:00:02 $16.64 4,200
16:00:02 $16.64 5
16:00:02 $16.64 100
16:00:02 $16.64 1,596

Usually during the day I'll see blocks of 100-500. Sometimes more. But then at the end of the day I'll see these huge numbers going through

I've noticed this on many different stocks. What III said "Day traders locking in profits" make sense. It doesnt really seem to effect the price but I was just curious because compared to the rest of the day those numbers jump out at me. Also it's after 4pm?

Often MMs are forced to buy/sell/hedge/re-balance/balance/liquidate portions of their books, this often times creates order "imbalances" where there are not enough mm/participants willing to fill the order so they put the order into what is called the opening or closing auction. Essentially, it is a late print.
 
Last edited:

Scientific Playa

Superstar
Supporter
Joined
Oct 13, 2013
Messages
13,930
Reputation
3,255
Daps
24,892
Reppin
Championships
Asset prices
Not fully inflated
Many investments are becoming expensive. But there is little sign of the mania that accompanies most bubbles
Dec 7th 2013 |

  • 20131207_FND001_0.jpg

    TALK of bubbles is in the air again. The Dow Jones Industrial Average has hit an all-time high. A loss-making technology firm (Twitter) has floated its shares on a flood of investor demand. Private-equity groups are buying companies using amounts of debt not seen since 2008. A record price (more than $50m) has just been set for a penthouse in Manhattan. A triptych by Francis Bacon became the most expensive piece of art sold at an auction when Christie’s flogged it for $142.4m last month. Robert Shiller of Yale University, who correctly identified bubbles in tech stocks in the late 1990s and in property in the 2000s, has expressed unease about giddy American share valuations.

    All this suggests that wealthy investors have become increasingly confident. The question is whether they are right to be. Under certain circumstances, fast-rising asset prices are justified. New industries can emerge and create corporate giants (Microsoft, Apple and Google, for example); countries can change their economic policy and grow rapidly (Japan in the 1960s, China in the 1990s). How, then, do you tell a bull market from a bubble?
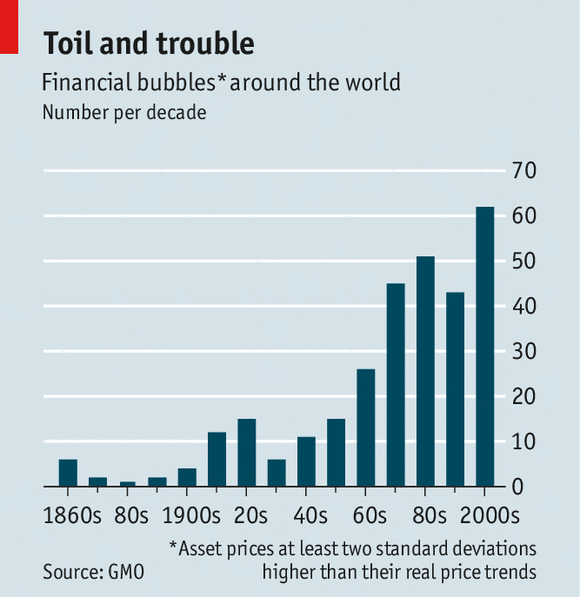
    Mr Shiller describes a bubble as “a psycho-economic phenomenon. It’s like a mental illness. It is marked by excessive enthusiasm, participation of the news media and feelings of regret among people who weren’t in the bubble.” They are often enlarged by an expansion of credit. But establishing an objective definition is hard. For GMO, a fund-management group, a bubble is an increase in the price of an asset of more than two standard deviations above the trend, taking inflation into account.

    20131207_FNC887.png

    Using that standard, GMO has identified 330 bubbles between 1720 and 2010. They have become much more frequent in recent decades (see chart). That is partly due to there being more markets to analyse these days. But it is probably also a reflection of the explosion in global capital flows that followed the collapse of the Bretton Woods system of fixed exchange rates in the early 1970s. It is hardly surprising to find that more bubbles have been inflated as investors have rushed round the globe in search of the next big thing.

    Many economists have struggled to accept that bubbles exist, as that is difficult to square with the idea of efficient markets. If assets are obviously overpriced, why don’t smart investors take advantage and sell? Edward Chancellor of GMO argues that investors can find it hard to arbitrage away a bubble. Manias can last much longer than investors think, as many contrarians discovered to their cost during the dotcom boom of the late 1990s. Nor do investors know whether a bubble will be resolved through a sharp fall in prices or a long period of stasis, in which inflation erodes prices in real terms (something that happened to British houses in the 1970s).

    Dimitri Vayanos and Paul Woolley of the London School of Economics have suggested that problems of agency contribute to bubbles. Investors do not buy shares directly but hire fund managers to do it on their behalf. They tend to select managers who have performed well in prior years. As the managers receive cash from new clients, they buy their favourite stocks which, by definition, will have performed well—witness the enormous sums flowing into tech funds in the late 1990s. The favoured stocks get driven even higher.

    Property bubbles also have a self-reinforcing element. Most properties are bought with money borrowed from banks. When prices are rising, banks are more confident about lending money; the greater availability of credit means that borrowers can afford higher prices, and so on. Conversely, of course, when banks become unwilling to lend more money, prices can collapse.

    Many commentators believe current monetary policy may be encouraging bubbles to form (see Free exchange). Nominal interest rates in much of the developed world are close to zero, and central banks have been buying bonds through the policy of quantitative easing. The intention is to reduce yields on the safest assets and so encourage investors to buy riskier ones, reducing financing costs for companies and boosting economic confidence through the wealth effect.

    Low interest rates may also persuade some investors that risky assets are worth more. If one lowers the rate at which future cashflows are discounted, then the present value of an asset rises. But that is only if other things stay equal. Central banks have adopted their current monetary policy because they worry that the outlook for economic growth has deteriorated; if they are right, then investors should be reducing their estimates for the cashflows they will receive from dividends, rents, etc.

    That may leave markets exposed to two risks: that the income from assets does not rise as quickly as investors hope and that capital values decline sharply if monetary policy changes. In its latest report on financial stability, the Bank of England acknowledges that monetary policy has had spillover effects. “Large capital flows into emerging economies have enabled credit levels in these countries to rise sharply,” it states. Emerging markets wobbled this summer when the Federal Reserve spoke of scaling back its monetary stimulus.

    Looking back over five years, it is worth reflecting that markets have rebounded from some huge falls in 2008 and early 2009. Investors’ returns over the last 15 years have not been great. But there are a number of markets that look overvalued on an historical basis. American equities are trading at a cyclically-adjusted price-earnings ratio of 25, according to Mr Shiller. This is much higher than the historic average of 16.5 but below the levels reached in the great peaks of 1929 and 2000. Corporate profits are also at their highest level relative to GDP since the second world war, suggesting further growth is unlikely.

    Mr Shiller is not yet ready to declare a bubble in American equities, however. There is nothing like the same excitement about shares that was seen in the late 1990s; net flows into mutual funds only just turned positive this year. Another measure of public indifference is that CNBC, a television station that tracks the financial markets, suffered its lowest ratings since 2005 in the third quarter.

    Some would put government bonds into the bubble category: last year, yields in some markets reached the lowest levels on record. Buying bonds when yields are less than 2% has in the past led to heavy losses. Again, however, debt markets do not look too frothy by other measures. There is little talk at dinner parties of the massive profits to be earned on sovereign bonds. The biggest buyers have been central banks; there may be a problem when they try to unwind their purchases, but that moment does not look imminent.

    The Economist’s house-price indicators suggest that property in New Zealand, Canada and Australia is substantially overvalued (and GMO sees clear signs of bubbles in British and Swedish house prices). But Hong Kong is the only overvalued market where prices are still surging ahead—by almost 20% over the past year.

    The Japanese stockmarket is up 51% so far this year (in yen terms), but that constitutes little more than a recovery after nearly a quarter-century of disappointment. Venezuelan equities are up more than fivefold this year (and 273% in dollar terms) but that is not a market many international investors are excited about.

    When it comes to collectables like art and fine wine, high prices may simply reflect inequality in the developed world. Throughout history, the rich have liked to demonstrate their status by displaying luxury goods that their inferiors are unable to afford. An Old Master can add real va-va-voom to your Manhattan penthouse.

    The asset with a price trajectory most like a satellite launch—until a slump on December 5th— is Bitcoin, an electronic currency. The news media had excitedly chronicled its ascent. Those buying faddish financial instruments without intrinsic value may do well to remember the adage “Up like a rocket, down like a stick.”

    http://www.economist.com/news/finan...re-becoming-expensive-there-little-sign-mania
 

Hiphoplives4eva

Solid Gold Dashikis
Supporter
Joined
Apr 30, 2012
Messages
42,423
Reputation
3,805
Daps
152,087
Reppin
black love, unity, and music
Was doing research on Chinese stocks some time back. Came across this article: http://seekingalpha.com/article/468691-pwc-zhong-tian-a-chinese-auditor-with-a-flawless-record

I know there has been alot more recent discussions on the auditing of Chinese companies. So take it for what it is.

In general, i stay the hell away from Chinese stocks as i really don't trust the government at all. At any time, any company can simply be taken over by the government or banned from doing business it seems.

I'm kind of mad i missed the BAIDU run up though.
 

TigerLord

Rookie
Joined
May 29, 2012
Messages
145
Reputation
110
Daps
246
Reppin
NULL
In general, i stay the hell away from Chinese stocks as i really don't trust the government at all. At any time, any company can simply be taken over by the government or banned from doing business it seems.

I'm kind of mad i missed the BAIDU run up though.

Yeah I hear you. Havent played any chinese stocks yet. Seems like playing with fire. Was tempted to jump into NQ after the Muddy Waters article came out and it dropped so drastically. Figured it was an oversell opportunity. Decided there were better risk/reward opportunities and passed.
 
Top