
iceberg_is_on_fire
Wearing Lions gear when it wasn't cool
Got one for you:
Instructions
1. Please add the custom data inputs (Disease based service line, In network physicians) into the Market Share Data tab
2. Create a graph showing in network market share by disease based service line
I'm unsure about sharing the file but here is a screenshot:

I placed this formula in "DiseaseBased" sheet:
=VLOOKUP($A2,$A$1:$C$3755,1,0)
And this in the "In Network" sheet:
=VLOOKUP($A2,A2:A1318,1,0)
I think the best way though is to copy and paste work from "DiseaseBased" & "In Network" sheets into "Custom" sheets, then using VLOOKUP to transfer it into "Market Share" [I think =VLOOKUP(Q2,'DiseaseBased'!,$A$1:$C$3755,1,0)] and =VLOOKUP(R2,'InNetwork'!A2:A1318,1,0)
Then add a Pivot table to get the values they are asking for before doing either a Circle graph or a bar graph
I'm unsure if this is the right way as I was stuck after copying the cells (the structure in order to make the graph)
Any help is appreciated
What's good breh, without seeing everything, I can only take a stab at this.
However, I found something in my past that might serve as something that you need as I keep my more elaborate excel files through my career. Looking at what is present and what I believe you are asking for, indexing created tables with some drop downs for dynamic data results is what you ultimately want.
I've uploaded the file in question and I've put a few pics to talk about. I don't care about the data, its purchase order data from nearly a decade ago from a company many moons ago.
File link
Easyupload.io - Upload Files and Share Them Easily
Uplaod files easily and share them with your friends and colleagues. File upload solution for everyone. Upload big files and get a link to share effortlesly.
 easyupload.io
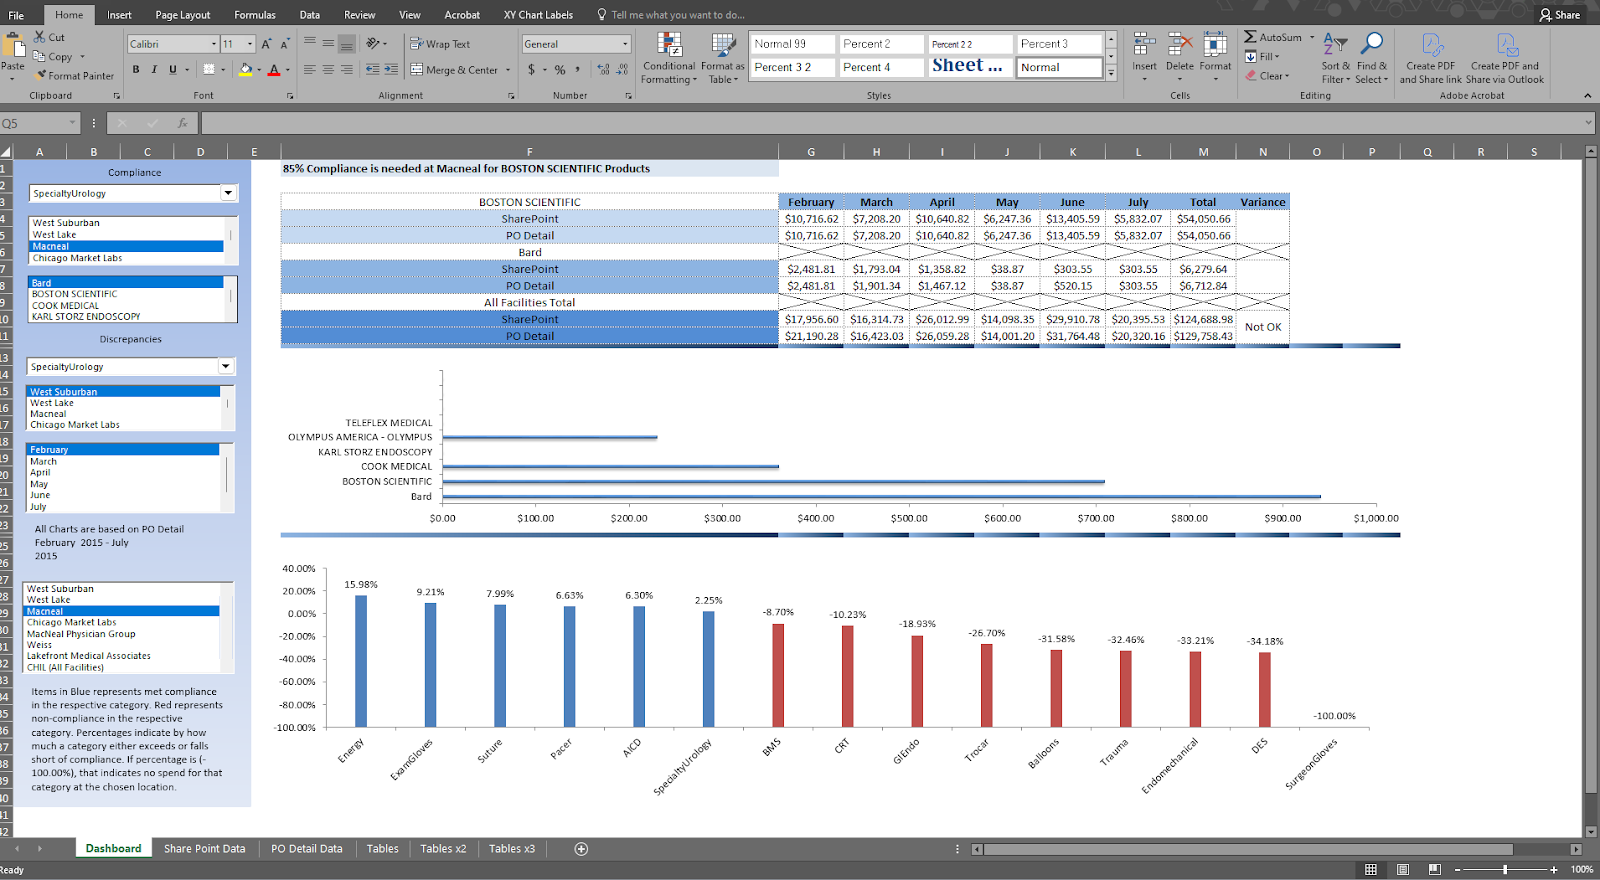
Pic #1
What I'm trying to do here is a lot of things. I'm trying to make sure that we are reaching compliance with our purchases from our vendors so that we remain on track with our GPO so that we can get the best tier of pricing for our products. I'm comparing between two databases, sharepoint which comes from the national numbers and our own internal PO detail. The top three drop downs/combo boxes correspond with the data that I spoke of above under the header of compliance. The next three drop downs/combo boxes relate to the amount of spend for that discipline, location and month for those vendors. The bottom combo box is just to show in rollup fashion, which product disciplines are above or below compliance. Blue means that it is and by how much of a percentage, red means that is isn't and by how much of a percentage that it is off.


This is the formula in one of the cells. I don't show that to intimidate though. It's actually an easier formula to put together than it looks. I'm available to explain more to anyone if they download the file and pick it apart for questions.
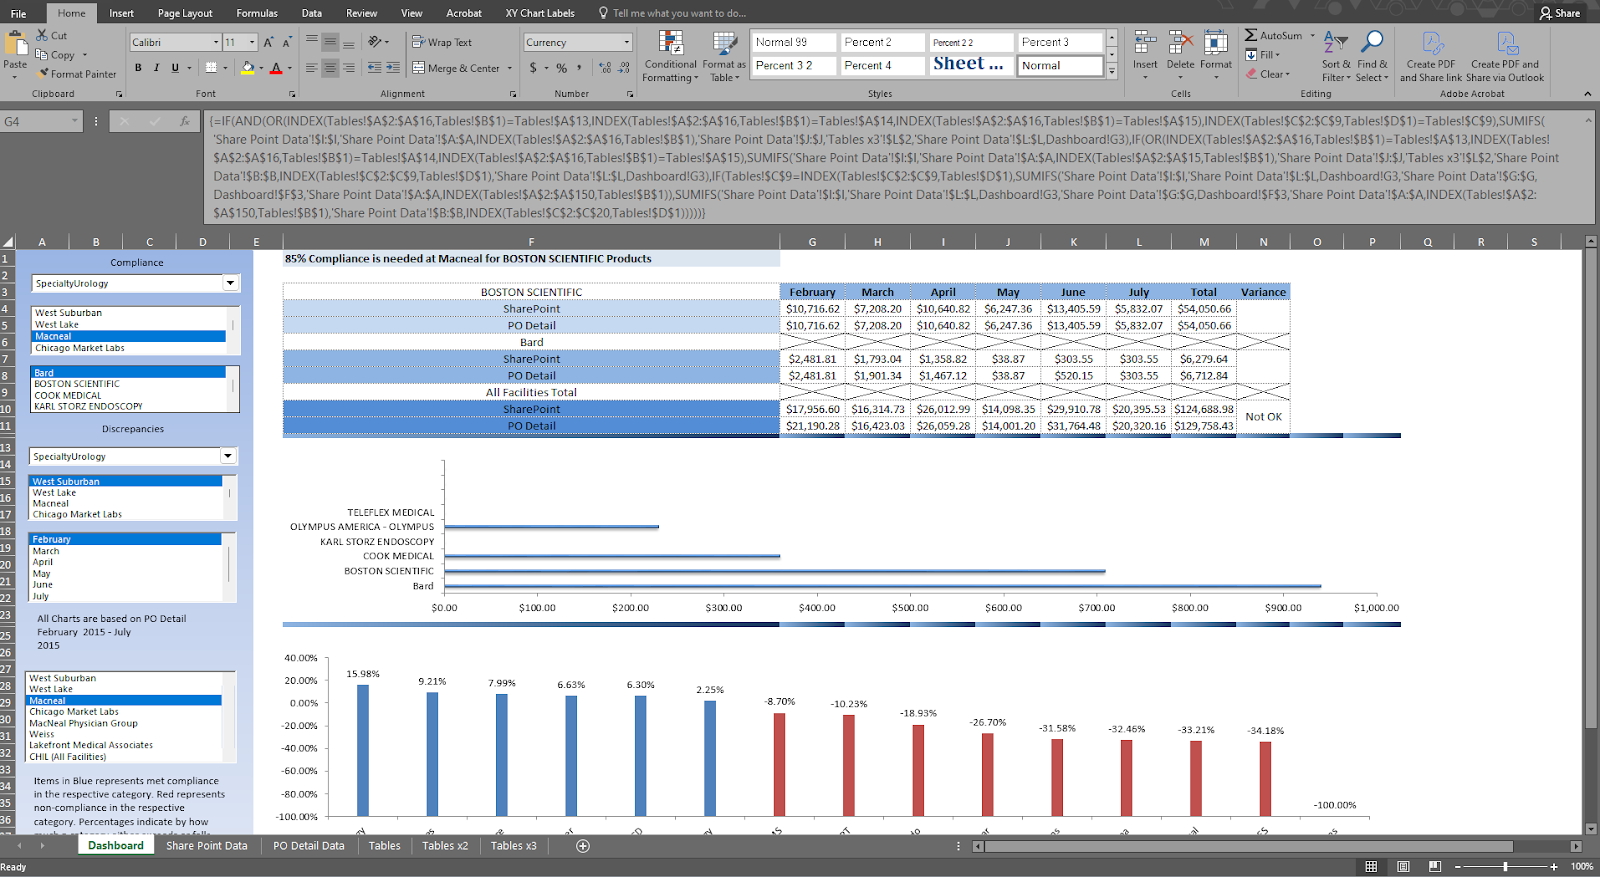
I don't think that you need anything this detailed but I think what you need is along these lines.
