Should I go see Hunger Games or Thanksgiving this week? 


The Marvels Has the MCU's Worst Opening of All Time: Weekend Box Office Results (Nov. 10-12)
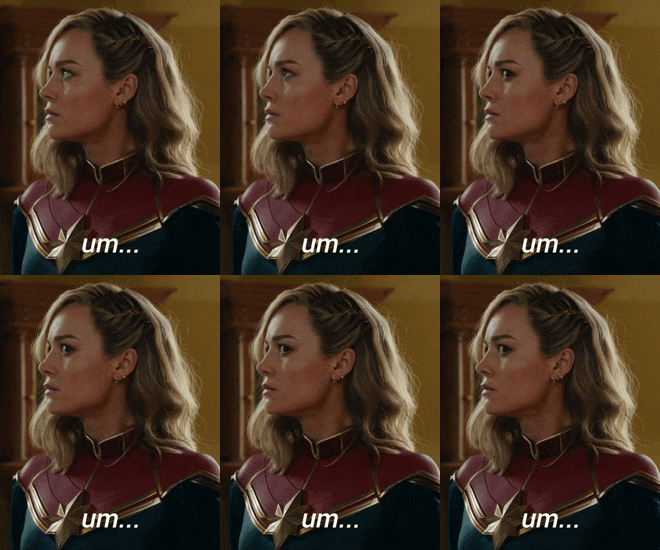
Higher? Further? Faster? Together? Brie Larson has captained the sinking ship that is The Marvels all the way to the MCU's worst ever opening with a putrid $47M. That shatters the previous record holder, The Incredible Hulk's $55.1M from all the way back in 2008. It's an unbelievable 69.4% drop from Captain Marvel's $153.4M opening in 2018.
It don't stop there. The (anything but) Marvels' $110.3M global opening is less than Guardians of the Galaxy 3's $118.4M domestic opening.Its global opening barely outdid Ant-Man: Quantumania's $106.1M domestic opening.
Way to put a stain on the 2023 MCU film releases.
But wait. There's more. That $47M opening is good for only the 40th best of the year. Some other notable releases ahead on the chart? The Flash and its $55M.That didn't have the benefit of a previous billion dollar earning movie preceding it. Just the stench of the recently departed DCEU. How bout some sequels? Creed lll (co-starring Kang the Conqueror himself) did $58.3M.
How bout the $61M opening of Transformers: Rose of the Beasts? Fast X did $67M. John Wick 4 opened to the tune of $73.8M. Not a sequel, but we just had Five Nights at Freddy's just do $80M.
What a disaster. It got an audience B grade from CinemaScore, down from Captain Marvel's A. A complete collapse.The Marvels, with its 3 stars, bad guy, director, all 3 of its writers, composer and one of its editors, just set women in film back 50 years.


Superhero fatigue? Or nobody gives a fukk about the Marvels?


 That's a genuine surprise to me, but maybe it shouldn't be. Audiences gave this an A cinemascore just like the first Trolls movie in 2016. This should help Universal make up for the disaster that was Ruby Gillman. Trolls 3 nearly doubled its entire $15.7M run.


 Enjoy the fake trailer.

Rank | LW | Movie | Gross | %± LW | Theaters | Total Gross | Weeks | Distributor |
| 1 | - | The Hunger Games: The Ballad of Songbirds & Snakes | $44,000,000 | - | 3,776 | $44,000,000 | 1 | LionsGate |
| 2 | - | Trolls Band Together | $30,600,000 | - | 3,870 | $31,770,000 | 1 | Universal |
| 3 | 1 | The Marvels | $10,200,000 | -77.9% | 4,030 | $65,024,806 | 2 | Disney |
| 4 | - | Thanksgiving | $10,200,000 | - | 3,204 | $10,200,000 | 1 | TriStar Pictures |
| 5 | 2 | Five Nights at Freddy's | $3,500,000 | -61.1% | 2,829 | $132,611,720 | 4 | Universal |
| 6 | 6 | The Holdovers | $2,700,000 | -16.2% | 1,478 | $8,357,480 | 4 | Focus Features |
| 7 | - | Next Goal Wins | $2,500,000 | - | 2,240 | $2,500,000 | 1 | Searchlight Pictures |
| 8 | 3 | Taylor Swift: The Eras Tour | $2,400,000 | -60.6% | 1,573 | $175,313,432 | 6 | AMC |
| 9 | 4 | Priscilla | $2,326,380 | -49.4% | 1,802 | $16,982,259 | 4 | A24 |
| 10 | 5 | Killers of the Flower Moon | $1,920,000 | -58.1% | 1,714 | $63,570,032 | 5 | Paramount |
What did you end up doing? I recommend Hunger Games. Plan to do Thanksgiving this week too.Should I go see Hunger Games or Thanksgiving this week?
neither one. My car got broken into Friday night/Saturday morning and i ended up spending the weekend getting the window fixed and cancelling my debit cards and shyt. I might see one of them this week sometime though.What did you end up doing? I recommend Hunger Games. Plan to do Thanksgiving this week too.
Damn, that's horrible. Sorry that happened. Glad you're safe though.neither one. My car got broken into Friday night/Saturday morning and i ended up spending the weekend getting the window fixed and cancelling my debit cards and shyt. I might see one of them this week sometime though.


 Nope, it went to Apple TV+'s Napoleon, the new film from Ridley Scott. It's $20.4M 3-day is worse than Apple TV+'s other $200M epic, Killers of the Flower Moon's $23.2M opening. But that's why the holiday is for, which got it to $32.5M. Ridley and Joaquin packing up Marty, Bobby and Leo.
  At least, commercially. It got a B- CinemaScore to Killer's A- and a 6.7 on IMDb to Killer's 8.0. I never liked Joaquin. Hate Vanessa Kirby, too.


Rank | Movie | Gross | Theaters | Total Gross | Weeks | Distributor |
| 1 | The Hunger Games: The Ballad of Songbirds & Snakes | $42,000,000 | 3,776 | $98,373,951 | 2 | Lionsgate |
| 2 | Napoleon | $32,500,000 | 3,500 | $32,500,000 | 1 | Columbia |
| 3 | Wish | $31,700,000 | 3,900 | $31,700,000 | 1 | Disney |
| 4 | Trolls Band Together | $25,300,000 | 3,893 | $64,468,460 | 2 | Universal |
| 5 | Thanksgiving | $11,125,167 | 3,204 | $24,193,000 | 2 | TriStar Pictures |
| 6 | The Marvels | $9,200,000 | 3,070 | $76,853,446 | 3 | Disney |
| 7 | The Holdovers | $3,750,000 | 1,601 | $12,889,285 | 5 | Focus Features |
| 8 | Saltburn | $2,720,000 | 1,566 | $3,097,279 | 2 | Warner Bros. |
| 9 | Next Goal Wins | $2,575,000 | 2,240 | $5,742,770 | 2 | Searchlight Pictures |
| 10 | Five Nights at Freddy's | $2,500,000 | 1,882 | $136,209,340 | 5 | Universal |
 , but saw the Beyonce movie is dropping on Friday. I expect that to be #1 next weekend.
 Both films got A+ CinemaScores. Swifties turned out in full force compared to the BeyHive.
  Matter fact, The Eras Tour's $33.2M second weekend smoked this shyt by 36.7%. If I was black, I woulda sold half?


 It was no Violent Night, which opened with 4.5x more last year with $13.4M.
Rank | LW | Movie | Gross | %± LW | Theaters | Total Gross | Weeks | Distributor |
| 1 | - | Renaissance: A Film by Beyoncé | $21,000,000 | - | 2,539 | $21,000,000 | 1 | AMC Theaters |
| 2 | 1 | The Hunger Games: The Ballad of Songbirds & Snakes | $14,500,000 | -50.1% | 3,691 | $121,243,408 | 3 | Lionsgate |
| 3 | - | Godzilla Minus One | $11,031,954 | - | 2,308 | $11,031,954 | 1 | Toho International |
| 4 | 4 | Trolls Band Together | $7,600,000 | -57.3% | 3,613 | $74,833,055 | 3 | Universal |
| 5 | 3 | Wish | $7,412,000 | -62.4% | 3,900 | $41,955,942 | 2 | Disney |
| 6 | 2 | Napoleon | $7,125,000 | -65.5% | 3,500 | $45,740,243 | 2 | Columbia |
| 7 | - | Animal | $6,140,000 | - | 700 | $6,140,000 | 1 | Moksha Movies |
| 8 | - | The Shift | $4,358,377 | - | 2,450 | $4,358,377 | 1 | Angel Studios |
| 9 | - | Silent Night | $3,000,000 | - | 1,870 | $3,000,000 | 1 | Lionsgate |
| 10 | 5 | Thanksgiving | $2,630,000 | -62.8% | 2,506 | $28,377,633 | 3 | TriStar Pictures |