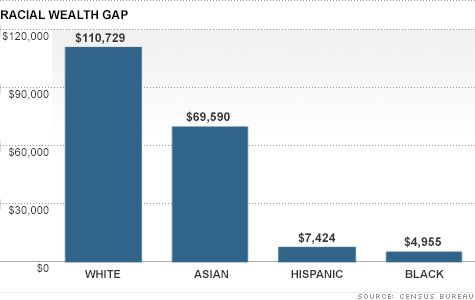
Oooooh you're one of those coli conspiracy theorists that believes the Vice President and the US government has an allegiance to Asians.
Let's talk about Reparations and why the George Floyd Bil has not passed yet?
FBI, Hate crime statistics comparison.
2004
67.5 percent resulted from an anti-black bias,
Slightly more than 5 percent (5.2) of racially motivated incidents were driven by an anti-Asian or Pacific Islander bias
Hate Crime 2004 Section 1
2005
"67.9 percent were victims of an anti-black bias.”
"4.9 percent were victims of an anti-Asian/Pacific Islander bias."
Hate Crime 2005
2006
"66.4 percent were victims of an offender’s anti-black bias.”
"4.8 percent were victims of an anti-Asian/Pacific Islander bias."
Hate Crime 2006
2007
"69.3 percent were victims of an offender’s anti-black bias”.
"4.7 percent were victims of an anti-Asian/Pacific Islander bias".
Hate Crime 2007
2008
"72.9 percent were victims of an offender’s anti-black bias.”
"4.7 percent were victims of an anti-Asian/Pacific Islander bias".
Hate Crime 2008
2009
"71.5 percent were victims because of an offender’s anti-black bias”
"3.7 percent were victims because of an anti-Asian/Pacific Islander bias".
Hate Crime 2009
2010
"70.0 percent were victims of an offender’s anti-black bias”.
"5.1 percent were victims of an anti-Asian/Pacific Islander bias".
Victims
Table 1
2011
"71.9 percent were victims of an offender’s anti-black bias.’
"4.8 percent were victims of an anti-Asian/Pacific Islander bias".
Victims
Table 1
2012
"66.2 percent were victims of an offender’s anti-black bias".
"4.1 percent were victims of an anti-Asian/Pacific Islander bias".
Victims
Table 1
2013
"66.5 percent were victims of crimes motivated by their offenders’ anti-Black or African American bias.”
"4.6 percent were victims of anti-Asian bias".
Victims
Table 1
2014
"62.7 percent were victims of crimes motivated by their offenders’ anti-Black or African American bias".
"6.2 percent were victims of anti-Asian bias".
Victims
Table 1
2015
"52.2 percent were victims of crimes motivated by their offenders’ anti-Black or African American bias".
"3.2 percent were victims of anti-Asian bias".
Victims
Table 1
2016
"50.2 percent were victims of crimes motivated by their offenders’ anti-Black or African American bias".
"3.1 percent were victims of anti-Asian bias".
Victims
Table 1
2017
"48.6 percent were victims of crimes motivated by their offenders’ anti-Black or African American bias.”
"3.3 percent were victims of anti-Asian bias".
Victims
Table 1
2018
“47.1 percent were victims of crimes motivated by offenders’ anti-Black or African American bias“
"3.4 percent were victims of anti-Asian bias".
Victims
Table 1
I. Murder
"Judging from exonerations, innocent black people are about seven times more likely to be convicted of murder than innocent white people. A major cause of the high number of black murder exonerations is the high homicide rate in the black community—a tragedy that kills many African Americans and sends many others to prison. Innocent defendants who are falsely convicted and exonerated do not contribute to this high homicide rate. They— like the families of victims who are killed—are deeply harmed by murders committed by others."
[...]
II. Sexual Assault
"Judging from exonerations, a black prisoner serving time for sexual assault is three- and-a-half times more likely to be innocent than a white sexual assault convict. The major cause for this huge racial disparity appears to be the high danger of mistaken eyewitness identification by white victims in violent crimes with black assailants."
[...]
“Since 1989, more than 1,800 defendants have been cleared in “group exonerations” that followed 15 large-scale police scandals in which officers systematically framed innocent defendants. The great majority were African-American defendants who were framed for drug crimes that never occurred. There are almost certainly many more such cases that remain hidden. pp. 21-25
[…]
"innocent black people are about 12 times more likely to be convicted of drug crimes than innocent white people. pp.16-17.
[…]
African Americans are more frequently stopped, searched, arrested, and convicted—including in cases in which they are innocent. The extreme form of this practice is systematic racial profiling in drug-law enforcement. pp. 20-21
[…]"
(Michigan State University)
"Overall, a total of 3400 law enforcement agencies reported 28,094 racially motivated hate crimes through NIBRS between 1992 and 2014. We used the subset data of the anti-Asian American, anti-African American, and anti-Hispanic incidents for our analysis. Furthermore, considering the purpose of the current study, we limited the victim type to individual victims, and offense type to violent crimes. These historical data made available sufficient cases to be analyzed and covered more jurisdictions. In total, there were 10,981 violent hate crime incidents against these three racial/ethnic groups in the dataset. Among which were 478 anti-Asian, 8628 anti-African American, and 1875 anti-Hispanic hate crimes."
(Yan Zhang, 2021 Jan 7;1-21.,
Hate Crimes against Asian Americans - American Journal of Criminal Justice)
Sorry, I thought I was having a conversation with a reasonably sane person. My bad.
You do realize the anti-Asian crime Bill has been passed? Or is that a conspiracy?
A host of statistical information on the Asian and Native Hawaiian and Other Pacific Islander population groups.

www.census.gov
Immigrants from Asia in the United States
MARCH 10, 2021
SPOTLIGHT
By Mary Hanna and Jeanne Batalova
Immigrants from Asia in the United States
Reckoning with Asian America
Jennifer Lee, Tiffany J. Huang
Science 02 Apr 2021:
Vol. 372, Issue 6537, pp. 8
DOI: 10.1126/science.abi6877
Reckoning with Asian America
"Nearly 1,000 people with Chinese surnames gave the group donations amounting to $86,000, according to hacked GiveSendGo data.
The locations of the donors stemmed from China, Hong Kong, Taiwan, and members of the Chinese community in the United States, reported
USA Today, which obtained the data from the whistleblower site
Distributed Denial of Secrets."
Proud Boys received uptick in donations from Chinese diaspora before Capitol riot: Report
Column: Black people make up 8% of L.A. population and 34% of its homeless. That's unacceptable
Race/Ethnicity of Homeless
Point-in-Time Count, January 2020, 2019, 2018
- Asians are slightly above 1% (1.2%).
- Blacks are constantly around 37.8% to 35.7%.
Homeless in Los Angeles County, California
LOS ANGELES COUNTY ECONOMIC DEVELOPMENT CORPORATION
- African-American families are in poverty, accounting for 20% of all African-American, compared to the Los Angeles County median of $55,750."
- Median household income is $40,650.
- The unemployment rate of African-Americans is 3 percentage points above all other workers in Los Angeles County.
- 344,780 African-Americans in Los Angeles County that hold a job.
- The economic impact in Los Angeles County of African-American-owned firms in 2012 was $11.8 billion.
https://laedc.org/wp-content/uploads/2016/09/African-American-Snapshot-Report.pdf
- Asian families are in poverty, accounting for 8.6% of all Asian families in Los Poverty by family type: Angeles County.
- Median household income is $70,440.
- The unemployment rate of Asians is 2.1 percentage points below other workers in Los Angeles County.
- 740,870 Asians in Los Angeles County that hold a job.
- The economic impact in Los Angeles County of Asian-owned firms in 2012 was $167.2 billion.
https://laedc.org/wp-content/uploads/2017/02/Asians_in-LA.pdf


 you just can’t make this up. She grabbed his phone and had him shook


