OfTheCross
Veteran

I thought Cali was the one having a "mass exodus"...but it's really the Northeast.

Mapped: A Decade of Population Growth and Decline in U.S. Counties
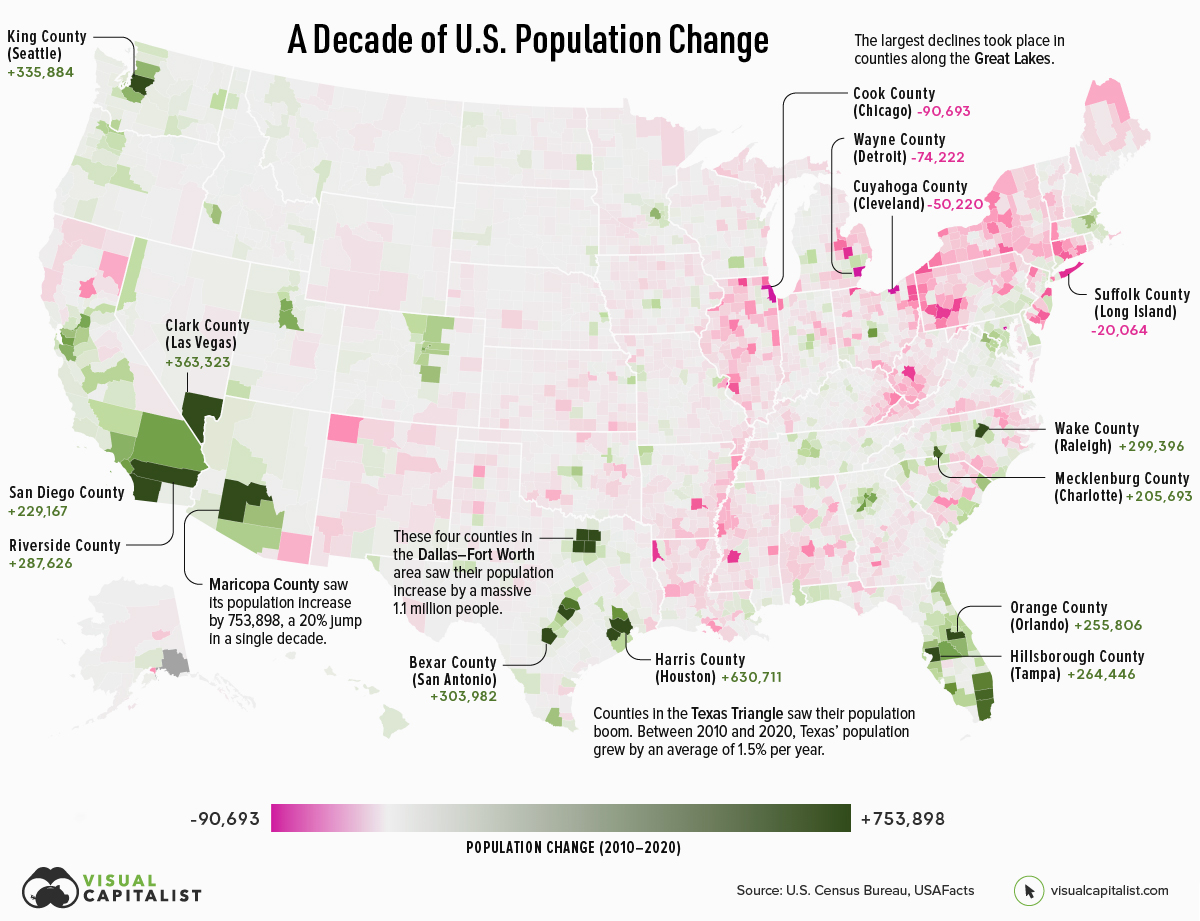
This map shows which counties in the U.S. have seen the most growth, and which places have seen their populations dwindle in the last 10 years.
 www.visualcapitalist.com

A Decade of Population Growth and Decline in U.S. Counties
There are a number of factors that determine how much a region’s population changes.If an area sees a high number of migrants, along with a strong birth rate and low death rate, then its population is bound to increase over time. On the flip side, if more people are leaving the area than coming in, and the region’s birth rate is low, then its population will likely decline.
Which areas in the United States are seeing the most growth, and which places are seeing their populations dwindle?
This map, using data from the U.S. Census Bureau, shows a decade of population movement across U.S. counties, painting a detailed picture of U.S. population growth between 2010 and 2020.
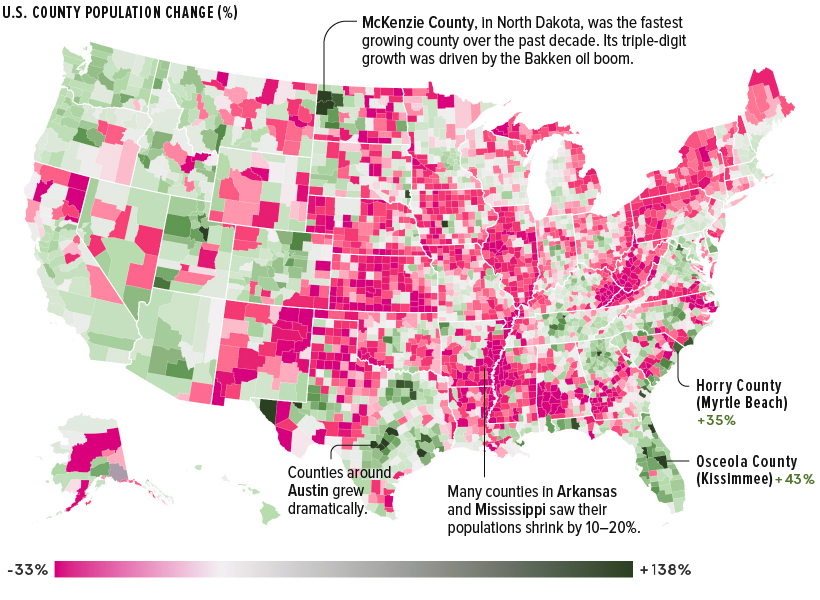
U.S. Population Growth in Percentage Terms (2010-2020)
While the map above is great at showing where the greatest number of Americans migrated, it downplays big changes in counties with smaller populations.For example, McKenzie County in North Dakota, with a 2020 population of just 15,242, was the fastest-growing U.S. county over the past decade. The county’s 138% increase was driven primarily by the Bakken oil boom in the area. High-growth counties in Texas also grew as new sources of energy were extracted in rural areas.
The nation’s counties are evenly divided between population increase and decline, and clear patterns emerge.

 couldnt buy a fukkin place by myself in mass. too expensive
 didnt even look closely at it