You are using an out of date browser. It may not display this or other websites correctly.
You should upgrade or use an alternative browser.
You should upgrade or use an alternative browser.
All I Want for Christmas is My 2 Furry, Family Friendly, Films Sitting Atop the Tree | The Domestic Box Office Thread | Dec. 27-29
- Thread starter Avisible Man
- Start date
More options
Who Replied?TheNatureBoy
Veteran
Those Moana 2 numbers 
Wicked still putting up big numbers in week 2
Gladiator 2 solid as well (Got snow this weekend, will try to catch it next week when it warms up).
Theater owners this Thanksgiving weekend looking at the numbers

Wicked still putting up big numbers in week 2
Gladiator 2 solid as well (Got snow this weekend, will try to catch it next week when it warms up).
Theater owners this Thanksgiving weekend looking at the numbers

221 milly over 5 days 

Avisible Man
S/N: 52093850
It's a MarshMoana World in the Winter: Weekend Box Office Results (Dec. 6-8)
Rank | LW | Movie | Gross | %± LW | Theaters | Total Gross | Weeks | Distributor |
| 1 | 1 | Moana 2 | $52,000,000 | -62.8% | 4,200 | $300,039,013 | 2 | Disney |
| 2 | 2 | Wicked | $34,850,000 | -57.1% | 3,885 | $320,509,270 | 3 | Universal |
| 3 | 3 | Gladiator II | $12,450,000 | -59.9% | 3,440 | $132,742,895 | 3 | Paramount |
| 4 | - | Pushpa: The Rule - Part 2 | $9,300,000 | - | 1,245 | $9,300,000 | 1 | AA Films |
| 5 | 4 | Red One | $7,003,917 | -45% | 3,150 | $85,785,481 | 4 | Amazon MGM |
| 6 | - | Interstellar: 2024 Re-Release | $4,425,000 | - | 165 | $4,425,000 | 1 | Paramount |
| 7 | - | Solo Leveling: ReAwakening | $2,400,000 | - | 846 | $2,400,000 | 1 | Sony |
| 8 | - | Y2K | $2,113,923 | - | 2,108 | $2,113,923 | 1 | A24 |
| 9 | - | For King + Country: A Drummer Boy Christmas - Live | $2,055,486 | - | 1,540 | $2,617,135 | 1 | Fathom Events |
| 10 | 5 | The Best Christmas Pageant Ever | $1,525,000 | -52.6% | 1,633 | $34,490,377 | 5 | Lionsgate |
Red Shield
Global Domination
Don't see the top 3 changing this weekend. Next weekend tho.... Gladiator is definitely leaving the top 3.
Avisible Man
S/N: 52093850
Let it Mo! Let it Mo! Let it Mo(ana)!: Weekend Box Office Results (Dec. 13-15)
Moana 2 might be slowing down a lil bit it's still 3 for 3 with a $26.6M weekend. Its $337.5M running total makes it the 5th highest grossing movie of the year. It's not holding up during the weekdays but the weekends have really propelled it forward. It's also the #4 highest grossing film from Disney Animation Studios, over $100M more than Moana's $337.5M. Zootopia is third on the list with sales of $341.2M. That'll fall in the next few days.
With $717M banked globally, it's the 4th biggest movie worldwide this year and for Disney Animation Studios. Not bad for a movie originally conceived as a Disney+ series.


Wicked continues to kill it domestically, with another $22.5M. It's the 4th highest grossing movie this year with $359M, just behind Despicable Me 4's $361M. And, again, I still have no interest in seeing it.

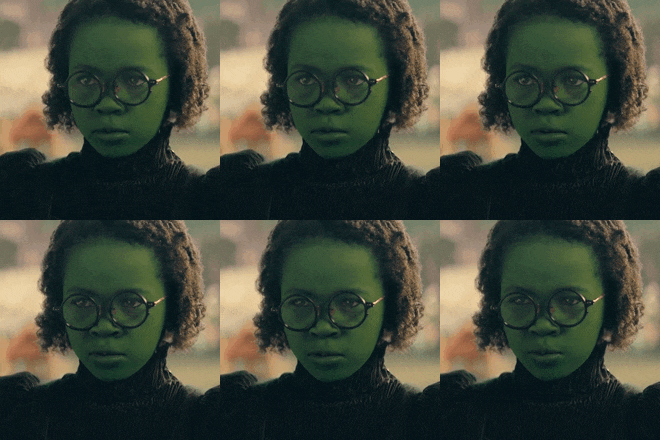
We got a new entry in third place. That would be Kraven the Hunter opening with a scintillating $11M.
 The lowest opening for a Sony Spider-Man-less Marvel movie, beating Madame Web's $15.3M.
  This indeed was Kraven's "Last Hunt."
That's too bad cuz this is one that I actually would want to see. Aaron Taylor-Johnson can't catch a break. The Fall Guy had good legs but underperformed with its opening and overseas. Then this debacle.
 It's no wonder they dropped that 28 Years Later trailer when this movie came out with him front and center.
  You know Sony is yearning for the days when Morbius was opening number one with $39M. As it is, that's all she wrote for Sony's Spider-Man universe. They will focus on Spider-Man 4 and Beyond the Spider-Verse.
I would say "at least they tried
 " but they really didn't. You don't put Spider-Man in any of these movies: what the hell you think is going to happen?

Gladiator ll took 4th place with $7.8M. It's made $145.9M, which is good for 14th place this year, passing The Wild Robot's $142.9M. It still has a ways to go before it can even dream of catching the original Gladiator's $187.7M, which is actually $375.2M when you adjust for inflation.

Opening in 5th place was The Lord of the Rings: The War of Rohirrim with a paltry $4.6M.
 Animation looked janky as fukk to me so I'ma do like a lotta people did and skip this one.
Notables
Red One is now streaming on Prime Video, where I watched it last night. Despite that, it's still playing in 3,003 theaters and made $4.4M. You never know, it might make it into the top five when the official numbers come out. It's shown good legs and is up to $92.6M, just $300K behind The Fall Guy's $92.9M final. And you know what? I enjoyed it.

After making $4.6M last weekend in it's 10th Anniversary re-release, Interstellar did another $3.3M. That makes $11.7M in total, bringing the Nolan classic to $199.8M.
Top Ten
Rank | LW | Movie | Gross | %± LW | Theaters | Total Gross | Weeks | Distributor |
| 1 | 1 | Moana 2 | $26,621,000 | -48.1% | 4,000 | $337,516,469 | 3 | Disney |
| 2 | 2 | Wicked | $22,500,000 | -38.3% | 3,689 | $359,038,440 | 4 | Universal |
| 3 | - | Kraven the Hunter | $11,000,000 | - | 3,211 | $11,000,000 | 1 | Sony |
| 4 | 3 | Gladiator II | $7,801,000 | -38% | 3,224 | $145,935,658 | 4 | Paramount |
| 5 | - | The Lord of the Rings: The War of the Rohirrim | $4,600,000 | - | 2,602 | $4,600,000 | 1 | Warner Bros. |
| 6 | 5 | Red One | $4,400,000 | -37.2% | 3,003 | $92,604,878 | 5 | Amazon MGM |
| 7 | 4 | Pushpa: The Rule - Part 2 | $3,700,000 | -60.2% | 631 | $13,000,000 | 2 | AA Films |
| 8 | 6 | Interstellar: 2024 Re-Release | $3,315,000 | -28% | 321 | $11,781,083 | 2 | Paramount |
| 9 | - | Interstella 5555: The 5tory of the 5ecret 5tar 5ystem | $2,328,339 | - | 641 | $2,328,339 | 1 | Trafalgar Releasing |
| 10 | 10 | The Best Christmas Pageant Ever | $1,350,000 | -10.4% | 1,519 | $36,663,106 | 6 | Lionsgate |
Last edited:
TheNatureBoy
Veteran
Kraven and LOTR putting up weak numbers, isn't too surprising. Good that Sony seems to be abandoning their non Spiderman films now. At least they were able to make Venom work for them.
Next week will be interesting to see how much Sonic 3 and Mufasa put up.
Next week will be interesting to see how much Sonic 3 and Mufasa put up.
Avisible Man
S/N: 52093850
Sonic is the Fastest Animated Animal Out the Gate; Hedgehog #3 Races to #1: Weekend Box Office Results (Dec. 20-22)
After 3 straight weeks in the top spot with Moana 2, Disney was looking to make it 4 for 4 with the release of Mufasa: The Lion King. Any other weekend and it woulda opened in #1 if not for the upstart, hot shot courtesy of Sega and Paramount. I'm talking about none other than Sonic the Hedgehog 3 with a $62 million number one opening. That's the 10th best opening and 12th biggest weekend of the year. How fitting during the most wonderful time of the year?

That is a great start. However, it is not the best opening for the Sonic franchise. That otter actually goes to Sonic the Hedgehog 2, which debuted with the $72.1 million in April of 2022, which was just before I joined the coli and started this thread. It's actually closer to Sonic the Hedgehog's $58 million opening than it is to its sequel. And that's with having the biggest budget in the franchise at $122 million. But like the prior two entries, the threequel gets an A cinemascore. So maybe it'll have good legs? But neither Sonic movie had much staying power.
For now, beating Disney will have to be enough. Who knew Hedgehogs were big game hunters like that? Chopping down Lion Kings.


The Lion King sequel, which is actually a prequel, titled Mufasa: The Lion King opened with a whimper, mustering a pathetic $35M.
 The Lion King, the 18th highest grossing movie of all time, had a $191.7M opening in 2019. Mufasa couldn't even muster 20% of The Lion King's opening.
  It was only off a cool 81.7%

What a horrible way for Disney to go out to end the year. But don't feel too bad for the imagineers. They just became the first studio to hit the $2B mark at the domestic box office. Now they the first studio to hit $5B globally since the Hong Kong Flu. But recency bias is a mufukka.


The hits keep coming for Disney, which couldn't even get a 3rd place finish, as Wicked came through with $13.5M to claim the spot. It played in 304 fewer theaters and still out earned Moana 2, despite opening one week prior.
 With $383.9M, it's currently, and will finish as the #3 movie of the year. It ain't singing its way past Deadpool & Wolverine's $636.7M. Big win for Universal, which will finish the year with 2 flicks in the top five - Despicable Me 4 will finish at #5 with $361M.

Moana 2 fell to 4th place after spending 3 weeks at #1, with $13.1M. Yes, Disney finishes with 2 in the top 5 but what a terrible weekend for them. Gotta call a flop a flop. They returned to their 2023 form at the end of 2024.

Nevertheless, Moana 2's $359M is currently #5 for the year and will pass the aforementioned Despicable Me 4 in the next couple of days to take 4th place on the year.

Homestead opened with $6M from fewer than 2,000 theaters to round out the top five. That's a nice output from Angel Studios. Neal McDonough, who you've seen in a bunch of shyt, but couldn't name him. But you know him when you see him like

And he doesn't even get top billing.
 Oh, and the director's last name is Smallbone.
Notables
With $153.9M, Gladiator ll passed It Ends With Us ($148.5M) to become the 13th highest grossing movie this year.
Kraven: The Hunter came home empty handed with $3.1M in its second weekend. That was a 71.8% drop, which, incredibly is worse than Madame Web's $5.9M, which was only a 61.4% decline.
 But, somehow, it was a better second weekend showing than The Marvels' 78.1% drop.
  Sony's worst Marvel movie gotta celebrate that win any way it can get it over Marvels' worst.

Red One is looking at $1.4M for a $95.4M running total. It was just Amazon's most watched movie ever on Prime. It's less than a million away from tripling its opening weekend.

A24's The Brutalist opened in 4 theaters for its Oscar run and did $266K.
Top Ten
Rank | LW | Movie | Gross | %± LW | Theaters | Total Gross | Weeks | Distributor |
| 1 | - | Sonic the Hedgehog 3 | $62,000,000 | - | 3,761 | $62,000,000 | 1 | Paramount |
| 2 | - | Mufasa: The Lion King | $35,000,000 | - | 4,100 | $35,000,000 | 1 | Disney |
| 3 | 2 | Wicked | $13,500,000 | -40.4% | 3,296 | $383,915,875 | 5 | Universal |
| 4 | 1 | Moana 2 | $13,100,000 | -50.6% | 3,600 | $359,068,328 | 4 | Disney |
| 5 | - | Homestead | $6,066,710 | - | 1,886 | $6,066,710 | 1 | Angel Studios |
| 6 | 4 | Gladiator II | $4,450,000 | -41.9% | 2,397 | $153,937,987 | 5 | Paramount |
| 7 | 3 | Kraven: The Hunter | $3,100,000 | -71.8% | 3,211 | $17,434,701 | 2 | Sony |
| 8 | 5 | The Lord of the Rings: The War of the Rohirrim | $1,270,000 | -72.1% | 2,602 | $7,370,171 | 2 | Warner Bros. |
| 9 | 10 | The Best Christmas Pageant Ever | $825,000 | -36.4% | 861 | $38,454,951 | 7 | Lionsgate |
| 10 | 12 | Queer | $364,240 | -53.9% | 379 | $2,837,173 | 4 | A24 |
Last edited:
He tends to update it as the day goes on.Damn. No write up. Homie said here and just bounced
Don't worry.
TheNatureBoy
Veteran
The hedgehog outran the lion this weekend  . Disney has to hope the Christmas season will carry Mufasa in the coming weeks for families and the international crowds come through. Even with Mufasa stumbling, this has been a good bounce back year for them.
Paramount has to be happy Sonic has turned into a reliable franchise for them.
 . Disney has to hope the Christmas season will carry Mufasa in the coming weeks for families and the international crowds come through. Even with Mufasa stumbling, this has been a good bounce back year for them.
Paramount has to be happy Sonic has turned into a reliable franchise for them.
Avisible Man
S/N: 52093850
All I Want for Christmas is My 2 Furry, Family Friendly, Films Sitting Atop the Tree: Weekend Box Office Results (Dec. 27-29)
It's the most wonderful time of year at movies. A time for big box office outputs, which is exactly what Santa brought us. Unfortunately for Disney, try as they might, they still couldn't escape the Naughty List, as Sonic the Hedgehog 3 eked out the most narrow of victories with $38M this weekend. Sonic made another $10.3M on Christmas to bring its

 pace, it should end the year as the 14th highest grossing movie with ~$150M. It would jump from its current 18th place spot and pass the likes of The Wild Robot ($143.1M) and It Ends with (Lawsuits) Us ($148.5M).
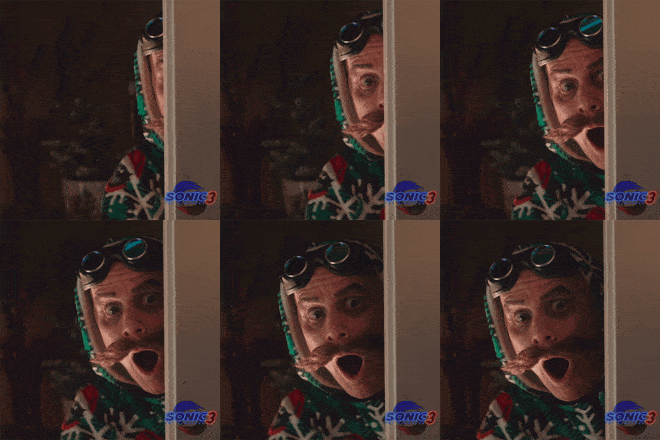
Now, Disney will try to claim the 5-day victory with Mufasa: The Lion King, which did have the best Christmas day with $14.7M. Great performance. But it wasn't enough to topple the Hedgehog, as it finished the weekend with $37.1M. However, remember, Mufasa opened with $35.4M. This $37.1M output was actually a 4.8% increase.
 Thank God for Christmas vacation (and 331 more theaters than Sonic 3) which is saving this from being a total disaster. Not a total Muflopsa.
This comeback cat's Christmas miracle puts it at $113.4M, passing Ghostbusters: Frozen Empire's $113.3M, to become the 19th biggest movie this year.

Sorry, Paul.

Finally, in 3rd place, we have newcomer, Nosferatu with $21.1M. Newcomer? A Dracula movie?
 Its $11.5M was the second best Christmas day gross. It finished its 5-day opening with $40.3M. That makes it the 6th highest grossing horror movie of the year, blowing past Speak No Evil's $36.9M. It's also Robert Eggers' best opening and highest grossing movie. He's only directed 4, but his previous best was The Northman with a $12.2M opening and $34.2M finish.
We'll see how it holds up with its B- CinemaScore, which audiences scored worse than Than the straight B they gave The Northman. I might skip this one in the theater. Not an Eggers fan. Didn't care for The VVitch
 . Didn't finish The Lighthouse. Didn't watch The Northman. His elevated horror may be a lil pretentious for me. And portentous for that matter.

 Is she hulking up? Where is Tedros Tedros to slap this bytch back into place?
4th place goes to the unstoppable Wicked, with $19.4M. Its $424.2M running total makes it one of only 3 movies to hit the $400M mark this year, trailing only Inside Out 2 and Deadpool & Wolverine.
 And it'll be on-demand at home on New Year's Eve, while it's still overly much in-demand at theaters.

We had one final Disney close out the top five, and no, it wasn't A Complete Unknown. Nah, it was anything but, as Moana 2 made another $18.2M. It's made $394.6M and has a real shot of becoming only the 4th $400M movie of the year. Until that happens, it's the 3rd highest grossing Disney Animation Studios film, trailing the two Frozen movies. Frozen, conveniently enough, finished its run with $400.9M, which Moana 2 will beat. Can it accomplish the feat before year's end?

Notables
Disney's (through Searchlight) Bob Dylan biopic, A Complete Unknown, could t even crack a top five opening with $11.6M. That was while playing in only 157 theaters than Nosferatu.
 Maybe people thought Nosferatu was Bob Dylan? Two decrepit, old white dudes.
  Its $7.2M was the 4th best total on Christmas. However, its $23.1M 5-day total was only $2M more than Nosferatu's 3-day weekend.
Top Ten
Rank | LW | Movie | Gross | %± LW | Theaters | Total Gross | Weeks | Xmas Gross | Distributor |
| 1 | 1 | Sonic the Hedgehog 3 | $38,000,000 | -36.8% | 3,769 | $137,552,146 | 2 | $10.3M | Paramount |
| 2 | 2 | Mufasa: The Lion King | $37,100,000 | +4.8% | 4,100 | $113,483,537 | 2 | $14.7M | Disney |
| 3 | - | Nosferatu | $21,150,000 | - | 2,992 | $40,304,475 | 1 | $11.5M | Focus Features |
| 4 | 3 | Wicked | $19,450,000 | +37.4% | 3,177 | $424,230,535 | 6 | $5.3M | Universal |
| 5 | 4 | Moana 2 | $18,200,000 | +37.8% | 3,410 | $394,605,425 | 5 | $4.2M | Disney |
| 6 | - | A Complete Unknown | $11,600,000 | - | 2,835 | $23,174,043 | 1 | $7.2M | Searchlight Pictures |
| 7 | - | Babygirl | $4,392,538 | - | 2,115 | $7,240,378 | 2 | $1.5M | A24 |
| 8 | 6 | Gladiator II | $4,150,099 | -8.9% | 1,865 | $163,100,000 | 6 | $1.4M | Paramount |
| 9 | 5 | Homestead | $3,190,170 | -46.8% | 1,769 | $12,897,241 | 2 | $1.1M | Angel Studios |
| 10 | - | The Fire Inside | $2,031,295 | - | 2,006 | $4,331,000 | 1 | $1.6M | Amazon MGM |
TheNatureBoy
Veteran
Family films/animation really carrying the BO to close out the year.
Didn't get a chance to see Nosferatu yet, checked my local IMAX and it seems Mustafa has all the screens locked up. Still might try to see it on a regular theater, since I have an extra day off this week.
Didn't get a chance to see Nosferatu yet, checked my local IMAX and it seems Mustafa has all the screens locked up. Still might try to see it on a regular theater, since I have an extra day off this week.