OfTheCross
Veteran
Do you feel it? 

 theintercept.com
What’s happened since then, during the years of the pandemic? Surely the situation must be even more dire today, after the last several years of high inflation. Just listen to what the Washington Post said in September following the Federal Reserve’s most recent big interest-rate hike:
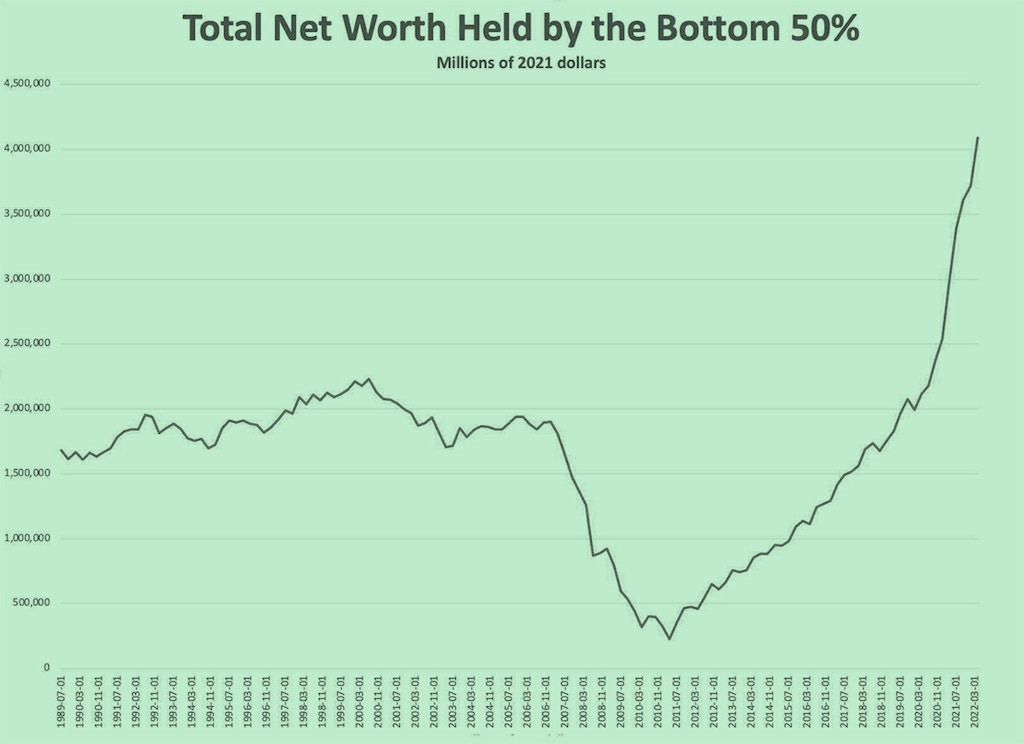
o let’s take a look at this graph from the Fed, which shows only the net worth of the bottom 50 percent of households and runs from 1989 until the second quarter of 2022:

St. Louis Federal Reserve and Josh Bivens, Economic Policy Institute
Startlingly, measured by this metric, the last several years have not been an economic disaster at all for the bottom 50 percent of U.S. households. Indeed, they’ve arguably been the best time during the past 30 years. That’s not to say that America’s poorer people are living in clover — they’re not. But in this way it is a clear improvement on the past: The net worth of the poorer 50 percent has doubled since the first quarter of 2020 and is now far higher than it’s ever been in U.S. history.
The story the graph tells is straightforward and, until recently, quite grim. The U.S. economy is twice the size it was in 1989, so you’d expect the net worth of the bottom 50 percent to have gradually increased during this period until it, too, doubled.
That isn’t what happened. At its start in 1989, the combined net worth of the poorer 50 percent was $1.7 trillion in current dollars. It slowly crept upward during Bill Clinton’s administration to $2.3 trillion in today’s money.
But it went nowhere during most of George W. Bush’s presidency.
Then, during the Great Recession caused by the implosion of the housing bubble, the net worth of the poorer 50 percent plunged along with home prices. Then it slowly crept back up until the first quarter of 2020. Since then it has zoomed skyward and is now over $4 trillion. (The Fed is measuring this somewhat differently than the CBO did, but the overall direction is the same in both data sets.)
The improved financial situation of Americans also shows up in other data. In 2013, only 50 percent of Americans reported that they could come up with $400 to cover an emergency expense, such as fixing a broken car. Now 68 percent do (although this figure is not inflation-adjusted, so $400 today is not the same as in 2013).
So why and how did this happened? And what does it mean?
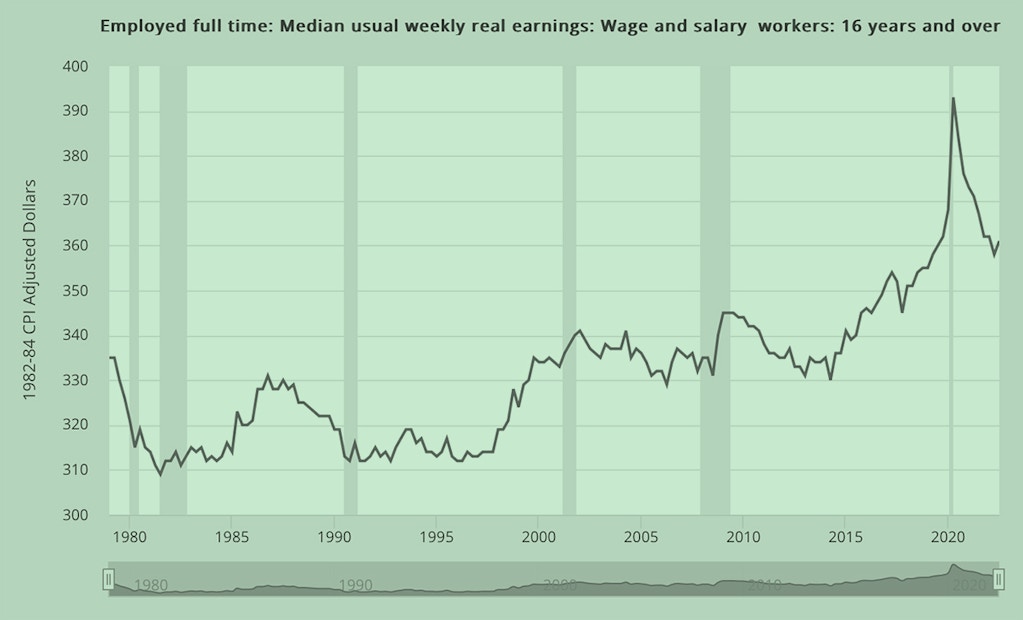
First of all, wages have not been decimated in real terms by inflation. That is, even as prices have gone up, wages have mostly kept pace. The real median wage actually increased sharply at the beginning of the pandemic; it has since fallen sharply and is now almost exactly the same as during the first quarter of 2020. (The increase was not quite as significant as it appears — it was partly due to the huge spike in lower-wage workers losing their job at the start of the pandemic. Hence the decrease in the median wage, as unemployment dropped, is also not as significant.)

St. Louis Federal Reserve
Perhaps half the increase in wealth is due to an increase in housing equity — thanks both to the run-up in home prices and inflation reducing the value of fixed-rate mortgages. The federal government also provided a great deal of financial support to the bottom 50 percent via the 2020 CARES Act, expanded unemployment benefits and the 2021 Child Tax Credit, and more. Together with low unemployment and increased worker leverage, that’s most of the explanation.
Thus we have a tale of two competing stories.
According to the Washington Post and many other media outlets, “low-income people have been hit the hardest” by recent inflation, and we must slow the economy (and lower wages and hike unemployment) for their benefit.
According to the actual numbers, these are good times for many, many Americans in the poorer 50 percent. That doesn’t mean that millions aren’t struggling, but the financial prospects for most were even worse in the past in a lower-inflation world, a situation that did not excite the warm concern of the corporate media. What we should concentrate on now is keeping the streak going, not bludgeoning the workforce into submission.
What happens next — and whether the modest increase in financial security that has accrued to the bottom 50 percent over the past two years endures — will largely depend on which story we believe. As of now, the people at the top of U.S. politics are going for the one not based on actual numbers.


The Wealth of America’s Bottom 50 Percent Has Doubled During the Pandemic Years
The wealth of America’s bottom 50 percent has doubled during the pandemic years.
What’s happened since then, during the years of the pandemic? Surely the situation must be even more dire today, after the last several years of high inflation. Just listen to what the Washington Post said in September following the Federal Reserve’s most recent big interest-rate hike:
Fed Chair Jerome H. Powell said more increases are likely — and they will hurt, slowing growth and weakening the labor market. Unfortunately, there is no other good option.
Inflation must be stopped. Mr. Powell stressed that Americans are already suffering from rising prices, and low-income people have been hit the hardest.
o let’s take a look at this graph from the Fed, which shows only the net worth of the bottom 50 percent of households and runs from 1989 until the second quarter of 2022:

St. Louis Federal Reserve and Josh Bivens, Economic Policy Institute
Startlingly, measured by this metric, the last several years have not been an economic disaster at all for the bottom 50 percent of U.S. households. Indeed, they’ve arguably been the best time during the past 30 years. That’s not to say that America’s poorer people are living in clover — they’re not. But in this way it is a clear improvement on the past: The net worth of the poorer 50 percent has doubled since the first quarter of 2020 and is now far higher than it’s ever been in U.S. history.
The story the graph tells is straightforward and, until recently, quite grim. The U.S. economy is twice the size it was in 1989, so you’d expect the net worth of the bottom 50 percent to have gradually increased during this period until it, too, doubled.
That isn’t what happened. At its start in 1989, the combined net worth of the poorer 50 percent was $1.7 trillion in current dollars. It slowly crept upward during Bill Clinton’s administration to $2.3 trillion in today’s money.
But it went nowhere during most of George W. Bush’s presidency.
Then, during the Great Recession caused by the implosion of the housing bubble, the net worth of the poorer 50 percent plunged along with home prices. Then it slowly crept back up until the first quarter of 2020. Since then it has zoomed skyward and is now over $4 trillion. (The Fed is measuring this somewhat differently than the CBO did, but the overall direction is the same in both data sets.)
The improved financial situation of Americans also shows up in other data. In 2013, only 50 percent of Americans reported that they could come up with $400 to cover an emergency expense, such as fixing a broken car. Now 68 percent do (although this figure is not inflation-adjusted, so $400 today is not the same as in 2013).
So why and how did this happened? And what does it mean?
First of all, wages have not been decimated in real terms by inflation. That is, even as prices have gone up, wages have mostly kept pace. The real median wage actually increased sharply at the beginning of the pandemic; it has since fallen sharply and is now almost exactly the same as during the first quarter of 2020. (The increase was not quite as significant as it appears — it was partly due to the huge spike in lower-wage workers losing their job at the start of the pandemic. Hence the decrease in the median wage, as unemployment dropped, is also not as significant.)

St. Louis Federal Reserve
Perhaps half the increase in wealth is due to an increase in housing equity — thanks both to the run-up in home prices and inflation reducing the value of fixed-rate mortgages. The federal government also provided a great deal of financial support to the bottom 50 percent via the 2020 CARES Act, expanded unemployment benefits and the 2021 Child Tax Credit, and more. Together with low unemployment and increased worker leverage, that’s most of the explanation.
Thus we have a tale of two competing stories.
According to the Washington Post and many other media outlets, “low-income people have been hit the hardest” by recent inflation, and we must slow the economy (and lower wages and hike unemployment) for their benefit.
According to the actual numbers, these are good times for many, many Americans in the poorer 50 percent. That doesn’t mean that millions aren’t struggling, but the financial prospects for most were even worse in the past in a lower-inflation world, a situation that did not excite the warm concern of the corporate media. What we should concentrate on now is keeping the streak going, not bludgeoning the workforce into submission.
What happens next — and whether the modest increase in financial security that has accrued to the bottom 50 percent over the past two years endures — will largely depend on which story we believe. As of now, the people at the top of U.S. politics are going for the one not based on actual numbers.