OfTheCross
Veteran

This Giant Map Shows All the Metropolitan Areas in the U.S.
This Giant Map Shows All the Metropolitan Areas in the U.S.
The United States is the third most populous country in the world, made up of close to 20,000 cities and towns, and 333 million individuals.
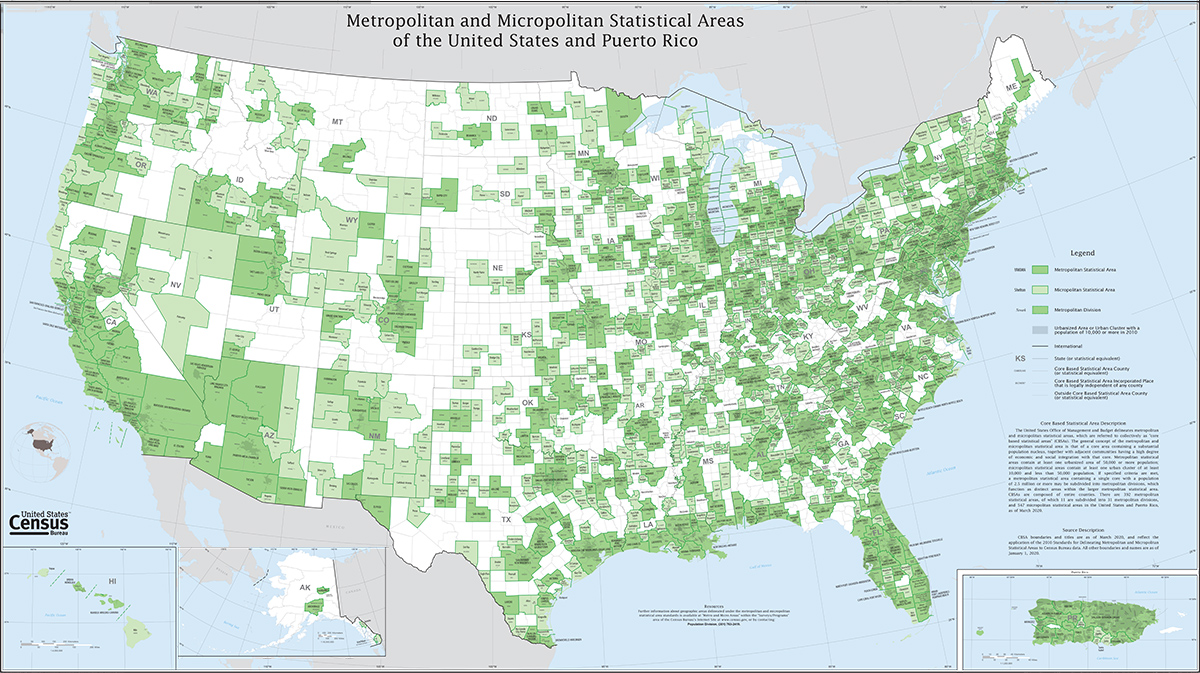
Dividing these population clusters into a coherent framework of statistical areas is no small feat, and the U.S. Census Bureau’s latest map shows just how complex of a task it is.
This enormous map—which covers the entire country, including Puerto Rico—includes 392 metropolitan statistical areas and 547 micropolitan statistical areas.
From Metro to Micro
The wide variety of population patterns around the country can make it tricky to divide regions up into uniform units. There are two main divisions to consider when viewing this map:
- Metropolitan Areas (metro areas) have at least one urban core area of at least 50,000 population. These are the largest population centers, sometimes encompassing many counties. In some instances, these metro areas are further subdivided into Metropolitan Divisions.
- Micropolitan Areas are the smallest areas measured on this map (indicated by a lighter shade of green). These smaller regions, which are generally located further away from large cities, have at least one urban core area of at least 10,000 but fewer than 50,000 people.
Another unique layer of data on this map is the shading that indicates the actual urbanized area within metro areas. In the example of Atlanta-Sandy Springs-Alpharetta, it’s easy to see how urban sprawl has expanded the urban area into a number of neighboring counties.
With this context in mind, we’ll take a closer look at three points of interest on the map that show this concept at work with varying degrees of complexity.


