OfTheCross
Veteran

Understanding economic disparities within the AAPI community
Key takeaways: More than 26 different nations make up the AAPI community. The broad generalization inherent in the AAPI categorization can obscure the economic reality for many groups within the AAPI community. Disaggregated hourly wage data show that groups within the AAPI community face...
Key takeaways:
- More than 26 different nations make up the AAPI community. The broad generalization inherent in the AAPI categorization can obscure the economic reality for many groups within the AAPI community.
- Disaggregated hourly wage data show that groups within the AAPI community face economic disparities. While AAPI average wages are close to the national average, many groups within the AAPI community lag behind.
- Differing immigration paths and histories within the AAPI community influence which groups might be doing better economically in the United States today.
Why disaggregation matters
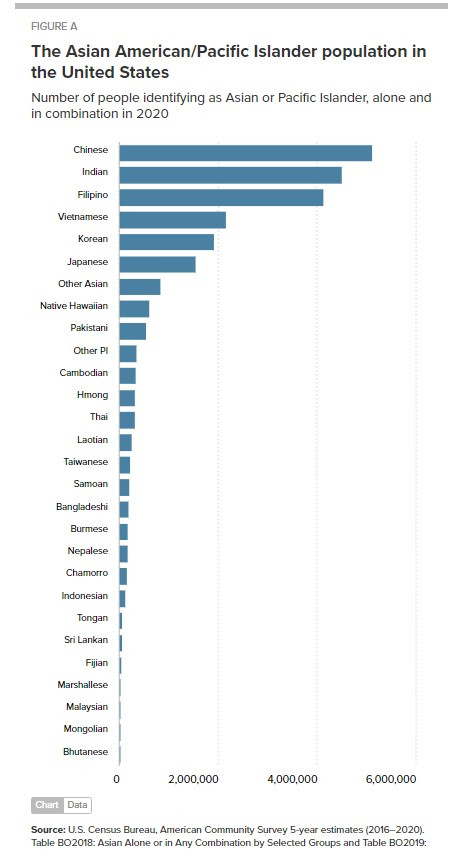
Figure A breaks down the AAPI population by country of origin. Examining disaggregated population sizes can tell us a few things. First, people with ancestry from a lot of different countries are subsumed within this broad categorization. Not even counting the “other” Asian American and Pacific Islanders, more than 26 different nations—each with their own distinct culture, history, and demographic pattern—make up the AAPI group. The broad generalization inherent in the AAPI categorization can have serious implications for economic policymaking as well as budget and resource allocation.Second, averages and estimates for the AAPI population as a whole will be weighted upwards by the largest racial groups. For example, Chinese Americans, Indian Americans, and Filipino Americans make up over half of the entire AAPI category in terms of population. This upward biasing can yield overall figures that are not representative of the entire AAPI population, nor the countries of origin represented in that catch-all.
What this means in practice is that aggregate economic statistics show AAPIs to be doing relatively well economically. For example, in May 2022, the seasonally adjusted unemployment rate for Asians (not including Pacific Islanders) was 2.4%, significantly lower than the national rate of 3.6%. Similarly, the median household income for Asian Americans as a whole was $16,000 higher than the national figure. While this accurately shows that many Asian Americans are economically secure, this is not the whole story.

Economic inequality within the AAPI community today
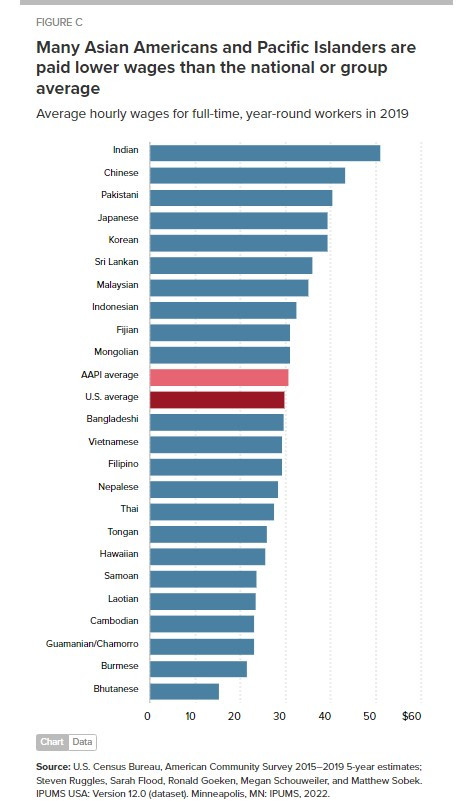
Indeed, our calculation of hourly wages for the disaggregated community shows us that groups within the AAPI community face economic disparities, both relative to the U.S. population as a whole and the AAPI population as a whole. Figure C shows average hourly wages for full-time, year-round workers. While the AAPI average is close to the national average, we can see just how many groups within the AAPI community lag behind. For example, people of Bhutanese descent were paid hourly wages ($15.36) that are just half the national average.
Understanding the differences within the AAPI population can help advocates and policymakers better address the economic challenges different groups face. The economic circumstances and policy solutions required vary regionally and by state as well, given differing immigration patterns. Recognizing that the AAPI community is very diverse and does not all experience the labor market and economy in the same way is paramount to making sure specific populations aren’t left behind. Policymakers must look beyond and behind the aggregate “Asian” statistics to truly understand the scope of the economic disparities.
Asian Americans have been facing staggering levels of xenophobic violence in the wake of the pandemic and economic recession. Sadly, this scapegoating and terror is not new, as anti-Asian violence has peppered American history, especially in periods of great economic upheaval and backlash. In the past, institutions have responded and reacted with policies entrenching systemic racism, from the Chinese Exclusion Act, the Alien Land Laws, the Supreme Court decision Korematsu vs. United States, and more. We have an opportunity now to do things differently, and to celebrate and honor the contributions of Asian Americans and Pacific Islanders in the United States. Our legislation and policies can push for economic mobility and boost wages and ensure that all Asian Americans and Pacific Islanders can achieve economic prosperity. AAPIs, who claim ancestry from over 20 nations across the globe, helped create the America and the American Dream we know today; our economic policies must ensure that they are all able to achieve it.
 india has always tried to separate themselves from that asian shyt

