ogc163
Superstar
Younger families in the U.S. made remarkable gains in median wealth in 2022, according to our analysis of the latest Survey of Consumer Finances data.1
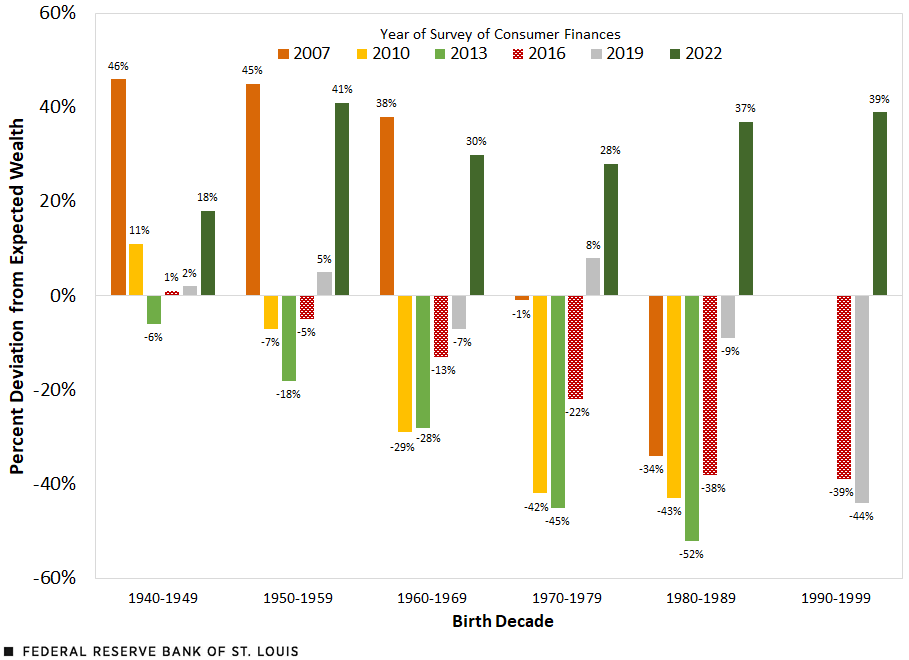
What did their wealth look like relative to where we expected it? In other words, how did their level of wealth compare with the estimated inflation-adjusted wealth held by all generations at the same age?2 We found that the median wealth of older millennials (those born between 1980 and 1989) was 37% above expectations. The wealth of younger millennials and older Gen Zers (those born between 1990 and 1999) was a similar 39% above expectations.
Six years ago, we published a similar analysis using data from 1989 through 2016 in which we looked at how the Great Recession had impacted young families. As it turned out, older millennials had median wealth that was 34% below expectations in 2016 (which we have since revised to 38% given a slightly different method).
At the time, we wondered if these older millennials would be part of a “lost generation” financially, or if their wealth would eventually converge to that of other generations. Three years later, in 2019, they had begun to catch up to other generations, but their median wealth was still 11% below expectations (revised to 9% given the latest method).3
As it turns out, older millennials experienced a sharp swing in their relative standing with median wealth expectations in 2022. Whereas for much of their adult lives, their wealth had been below where we would have expected it to be based on all generations at the same age, in 2022, their wealth was 37% above expectations—a 46 percentage point swing.
The figure below shows these changes, as well as deviations from median wealth expectations, for each SCF year (2007-22), organized by birth decade. At age 38, the average age of older millennials in 2022, our model predicted that the typical family would have about $95,000 in median wealth based on how all generations fared at the same average age. Instead, the typical older millennial had over $130,000. While there is wide variation within this group, the typical millennial born in the 1980s thus did better than we had expected. (In the appendix, see the methodology for further discussion on how these expectations were calculated.)

Those born in the 1990s—younger millennials and older Gen Zers—had an even sharper swing in wealth deviation from expectations between 2019 and 2022. Their wealth surged from 44% below expectations in 2019 to 39% above expectations in 2022—an 83 percentage point change.
In real terms, median wealth of these younger people more than quadrupled to $41,000 over this three-year period. Our estimates, based on a life-cycle model, accounted for the rapid growth in wealth accumulation that is typical for young families. That said, the actual rate of growth greatly exceeded expectations.
Younger generations’ assets may reveal primary factors behind their extraordinary wealth growth. After all, the definition of wealth used here is the difference between assets and liabilities.
The figures below detail how the real value of different types of assets changed relative to total assets owned for those born in the 1980s and 1990s between 2019 and 2022. Fortunately, we can break down asset growth. Assets in the SCF fall into two key categories: nonfinancial (e.g., the value of a home or vehicle) and financial (e.g., the value of a checking account or 401(k)). Importantly, looking at the change in assets (rather than wealth, which includes debt) will favor growth in nonfinancial assets that may be debt-financed (e.g., a mortgage loan for a house or a loan for a car).4
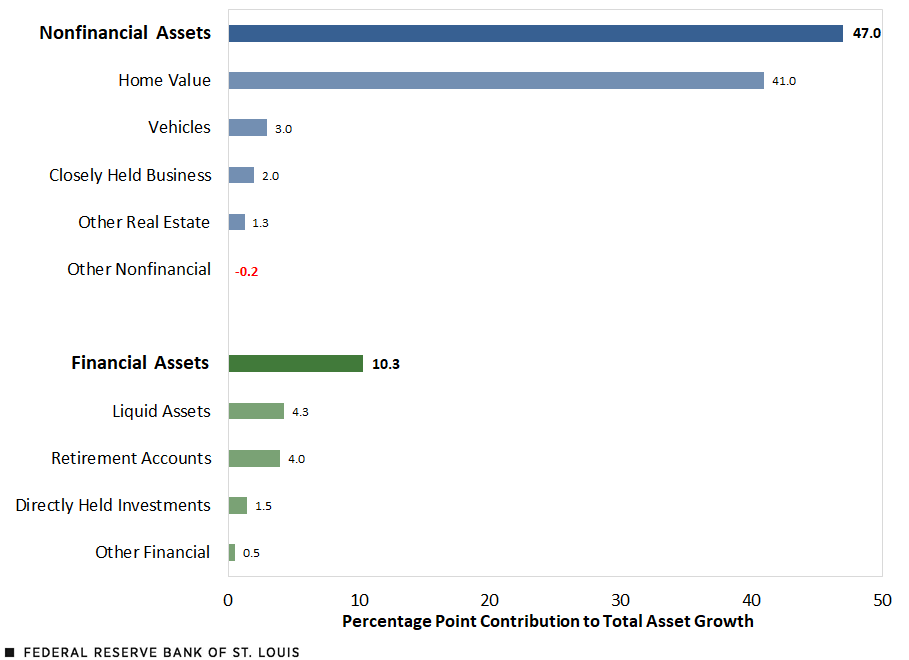
Between 2019 and 2022, the subset (middle of the wealth distribution) of total assets5 held by those born in the 1980s grew 57.3% in real terms. As shown in the second figure, nonfinancial assets and financial assets contributed 47 percentage points and 10.3 percentage points, respectively, to the total asset growth of 57.3%. When examining the individual components rather than key category, the bulk of that growth (41 percentage points) came from the increased value of housing assets.
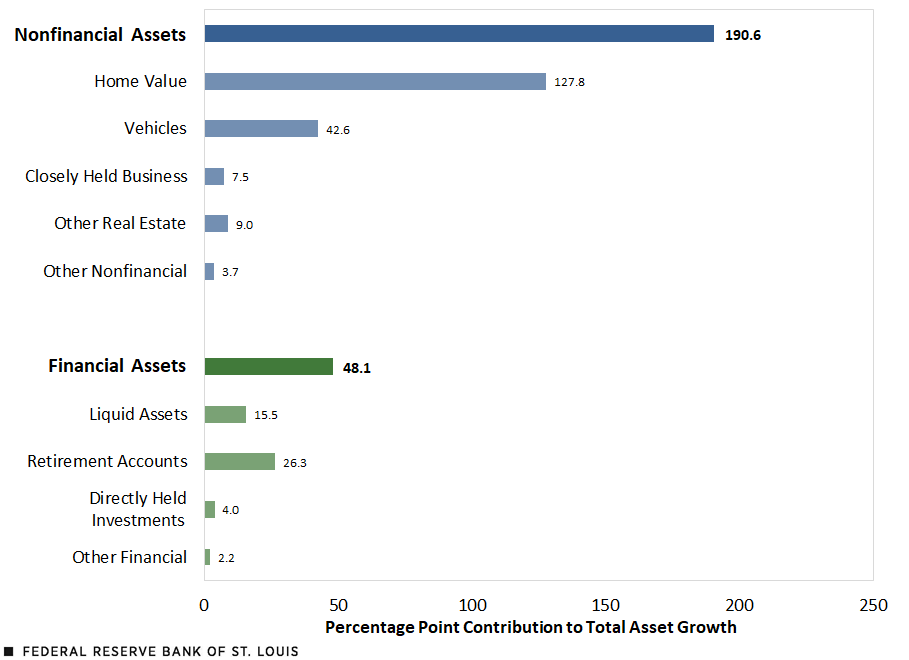
During that same period, the subset of total assets held by those born in the 1990s jumped 238.8% in real terms, of which nonfinancial assets and financial assets contributed 190.6 percentage points and 48.1 percentage points, respectively, to overall growth. As shown in the third figure, roughly half of that growth (127.8 percentage points) came from housing assets.
As both figures show, housing assets drove most of the overall growth; this is consistent with separate analysis of wealth gains by race and ethnicity.
What drove this increase in the real value of housing assets? Between 2019 and 2022, the homeownership rate jumped 18 percentage points, from 54.1% to 72.1%, for the group born in the 1980s. Similarly, the rate for the cohort born in the 1990s jumped 22 percentage points, from 13.6% to 35.6%. Over this period, home prices also appreciated considerably; therefore, the homes owned by these groups may have gone up in value since they were purchased, driving both home equity and wealth higher. And, while they’re not growing as fast as housing assets, liquid assets and retirement accounts also increased between 2019 and 2022.
Vehicle-related assets were also an important factor for the group born in the 1990s. As with homes, this is reflected in higher ownership rates: The share of families in this group that owned a vehicle jumped about 18 percentage points, from 73.8% to 92.1%. Vehicle ownership rates were up slightly for those born in the 1980s, but not by a large degree.


What did their wealth look like relative to where we expected it? In other words, how did their level of wealth compare with the estimated inflation-adjusted wealth held by all generations at the same age?2 We found that the median wealth of older millennials (those born between 1980 and 1989) was 37% above expectations. The wealth of younger millennials and older Gen Zers (those born between 1990 and 1999) was a similar 39% above expectations.
Millennial Wealth Grew Faster than Expected, Gaining Relative Ground
What makes the wealth numbers so notable is that they represent a sharp change from recent years.Six years ago, we published a similar analysis using data from 1989 through 2016 in which we looked at how the Great Recession had impacted young families. As it turned out, older millennials had median wealth that was 34% below expectations in 2016 (which we have since revised to 38% given a slightly different method).
At the time, we wondered if these older millennials would be part of a “lost generation” financially, or if their wealth would eventually converge to that of other generations. Three years later, in 2019, they had begun to catch up to other generations, but their median wealth was still 11% below expectations (revised to 9% given the latest method).3
As it turns out, older millennials experienced a sharp swing in their relative standing with median wealth expectations in 2022. Whereas for much of their adult lives, their wealth had been below where we would have expected it to be based on all generations at the same age, in 2022, their wealth was 37% above expectations—a 46 percentage point swing.
The figure below shows these changes, as well as deviations from median wealth expectations, for each SCF year (2007-22), organized by birth decade. At age 38, the average age of older millennials in 2022, our model predicted that the typical family would have about $95,000 in median wealth based on how all generations fared at the same average age. Instead, the typical older millennial had over $130,000. While there is wide variation within this group, the typical millennial born in the 1980s thus did better than we had expected. (In the appendix, see the methodology for further discussion on how these expectations were calculated.)

Those born in the 1990s—younger millennials and older Gen Zers—had an even sharper swing in wealth deviation from expectations between 2019 and 2022. Their wealth surged from 44% below expectations in 2019 to 39% above expectations in 2022—an 83 percentage point change.
In real terms, median wealth of these younger people more than quadrupled to $41,000 over this three-year period. Our estimates, based on a life-cycle model, accounted for the rapid growth in wealth accumulation that is typical for young families. That said, the actual rate of growth greatly exceeded expectations.
Real Estate Gains Largely Drove Overall Asset Growth
What might have propelled the wealth gains for younger generations?Younger generations’ assets may reveal primary factors behind their extraordinary wealth growth. After all, the definition of wealth used here is the difference between assets and liabilities.
The figures below detail how the real value of different types of assets changed relative to total assets owned for those born in the 1980s and 1990s between 2019 and 2022. Fortunately, we can break down asset growth. Assets in the SCF fall into two key categories: nonfinancial (e.g., the value of a home or vehicle) and financial (e.g., the value of a checking account or 401(k)). Importantly, looking at the change in assets (rather than wealth, which includes debt) will favor growth in nonfinancial assets that may be debt-financed (e.g., a mortgage loan for a house or a loan for a car).4
Between 2019 and 2022, the subset (middle of the wealth distribution) of total assets5 held by those born in the 1980s grew 57.3% in real terms. As shown in the second figure, nonfinancial assets and financial assets contributed 47 percentage points and 10.3 percentage points, respectively, to the total asset growth of 57.3%. When examining the individual components rather than key category, the bulk of that growth (41 percentage points) came from the increased value of housing assets.
During that same period, the subset of total assets held by those born in the 1990s jumped 238.8% in real terms, of which nonfinancial assets and financial assets contributed 190.6 percentage points and 48.1 percentage points, respectively, to overall growth. As shown in the third figure, roughly half of that growth (127.8 percentage points) came from housing assets.
As both figures show, housing assets drove most of the overall growth; this is consistent with separate analysis of wealth gains by race and ethnicity.
What drove this increase in the real value of housing assets? Between 2019 and 2022, the homeownership rate jumped 18 percentage points, from 54.1% to 72.1%, for the group born in the 1980s. Similarly, the rate for the cohort born in the 1990s jumped 22 percentage points, from 13.6% to 35.6%. Over this period, home prices also appreciated considerably; therefore, the homes owned by these groups may have gone up in value since they were purchased, driving both home equity and wealth higher. And, while they’re not growing as fast as housing assets, liquid assets and retirement accounts also increased between 2019 and 2022.
Vehicle-related assets were also an important factor for the group born in the 1990s. As with homes, this is reflected in higher ownership rates: The share of families in this group that owned a vehicle jumped about 18 percentage points, from 73.8% to 92.1%. Vehicle ownership rates were up slightly for those born in the 1980s, but not by a large degree.


