88m3
Fast Money & Foreign Objects
Income Inequality Leads to Less Happy People
Economic growth alone is not a sufficient condition for happiness, according to a recent study.

AP Photo/Susan Walsh
Fiscal conservatives might tell you that inequality is an inevitable and salutary side effect of the free enterprise system. In the U.S., after all, income inequality tends to be the most pronounced in highly innovative economies such as New York or the Silicon Valley. As a counterpoint, liberals might point to the many Scandinavian nations that are among the wealthiest, happiest, most productive, and most equal places on earth.
Who’s right? A recent study from Shigehiro Oishi at the University of Virginia and Selin Kesebir at the London Business School takes a close look at the connection between economic growth, inequality, and happiness across 34 nations. The big takeaway: Economic growth is associated with lower levels of happiness in nations with higher income inequality.
Advanced vs. less developed nations
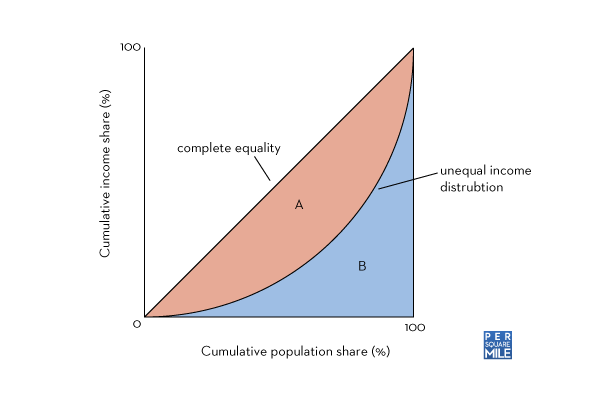
The study tests the connection between economic development, inequality, and happiness using two different data sets. The first data set covers happiness in 16 advanced nations like Denmark, France, and the United Kingdom using happiness data, or what researchers term “subjective well-being,” from surveys collected by the World Database of Happiness (developed by the Dutch sociologist Ruut Veenhoven). Both parts of the study use data on economic development measured as GDP per capita from the World Bank’s World Development Indicators, and on inequality based on the Gini coefficient (the standard measure of inequality) from the United Nations University World Institute for Development Economics Research.

What Makes Us the Happiest About the Places We Live
Urbanites and suburbanites in the U.S. have a lot more in common than you might have guessed.
While happiness did track the level of economic development across these 16 advanced nations, the results changed when inequality was added to the equation. Higher levels of inequality led to lower levels of happiness, even in the most economically advanced nations. In fact, the researchers found that the percentage of respondents who said they were very happy was inversely correlated with income inequality (with a negative correlation of −.618).
“Every single time income inequality decreased between two time points, the percentage of ‘very happy’ responses went up," the researchers write. “And every time income inequality increased, the percentage of ‘very happy’ responses went down. In other words, although economic growth was steady and strong during this period, the evenness of the income distribution was fluctuating, and happiness was inversely related to income inequality.”
The second dataset covers happiness in 18 Latin American countries with less advanced, less developed economies, using data from the Latin American Barometer (or Latinobarómetro), an annual public survey of happiness and well-being. Here the study generated two key findings. Again the researchers found that inequality dampened happiness. But in contrast to the findings for the advanced nations, they found that happiness did not increase alongside economic growth.
When economic growth can’t buy happiness
What might explain this difference between the Latin American countries and the more advanced nations? One possibility is that the developed nations have lower levels of inequality, so that even when inequality reaches a high point, wealth is still distributed fairly evenly within a nation. Indeed, the study found that it is the even distribution of economic growth across a population that accounts for greater happiness. In contrast, when economic growth is concentrated among a small portion of a nation’s elite, it does not lead to greater life satisfaction.
The chart below shows how the 34 nations in the study compare to one another. (Income inequality is plotted on the X-axis, and the correlation between happiness and economic output is on the Y-axis.) The fitted line slopes down and toward the right, indicating a negative correlation of −.397.
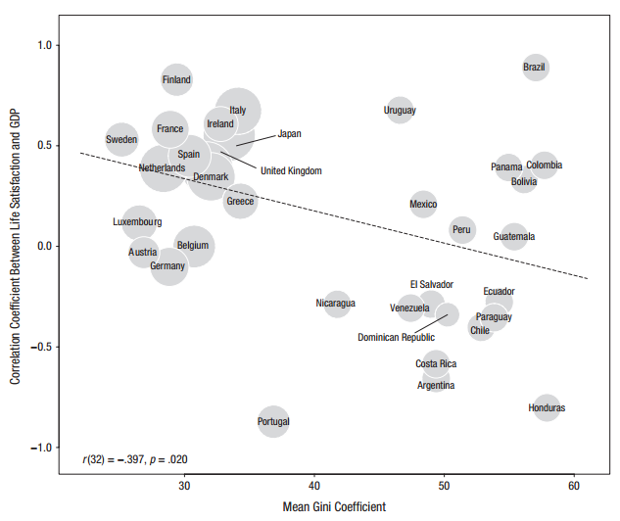
The nations in the lower right-hand quadrant have high inequality and negative correlations between happiness and GDP, and include Honduras, Argentina, Costa Rica, Chile, and Paraguay. The nations in the upper left-hand quadrant have low inequality and a positive correlation between happiness and GDP, and include Scandinavian and European nations like Sweden, Finland, the Netherlands, Denmark, and France—as well as Japan.
Other studies of nations and metros have found inequality to be negatively related to economic growth. A detailed 2008 study found that more unequal metros actually had slower overall rates of growth, after controlling for education and skill levels. A recent International Monetary Fund study found that lower levels of inequality are strongly and positively associated with faster economic growth, and that a greater redistribution of wealth contributes to economic growth as well. Studies of U.S. metros have also found greater inequality to be associated with less economic growth.
My own research on 138 nations finds inequality to be negatively correlated with creative capacity and competitiveness. In fact, I find that nations can be divided into two distinct camps: a low-road camp—which includes the United States and the United Kingdom—that combines high creativity with relatively high levels of inequality, and a high-road camp—which includes countries like Sweden, Finland, Denmark, and Norway—that combines high creativity with substantially lower inequality.
“Even growth is happy growth”
According to the study, there are two basic psychological reasons why inequality can dampen happiness, even in fast-growing nations. On the one hand, as inequality rises and a small band of elites gobble up all the spoils of growth, the broad mass of people may not directly experience any benefits—a familiar scenario in today’s world. On the other, high levels of inequality cause less advantaged people to see how relatively disadvantaged they are in comparison to these elite few.
Whatever the case may be, it’s clear that economic growth alone is not a sufficient condition for happiness. Instead, it is the distribution of this increased wealth that increases our satisfaction. As the study puts it, “Even growth is happy growth, and uneven growth is unhappy growth.” If nations want their citizens to be happy, they will have to accomplish the difficult task of ensuring that their income levels are balanced and fair.
Income Inequality Makes People Unhappy
Thoughts millennials?
Economic growth alone is not a sufficient condition for happiness, according to a recent study.
- RICHARD FLORIDA
- @Richard_Florida
- Dec 21, 2015
- 7 Comments
AP Photo/Susan Walsh
Fiscal conservatives might tell you that inequality is an inevitable and salutary side effect of the free enterprise system. In the U.S., after all, income inequality tends to be the most pronounced in highly innovative economies such as New York or the Silicon Valley. As a counterpoint, liberals might point to the many Scandinavian nations that are among the wealthiest, happiest, most productive, and most equal places on earth.
Who’s right? A recent study from Shigehiro Oishi at the University of Virginia and Selin Kesebir at the London Business School takes a close look at the connection between economic growth, inequality, and happiness across 34 nations. The big takeaway: Economic growth is associated with lower levels of happiness in nations with higher income inequality.
Advanced vs. less developed nations
The study tests the connection between economic development, inequality, and happiness using two different data sets. The first data set covers happiness in 16 advanced nations like Denmark, France, and the United Kingdom using happiness data, or what researchers term “subjective well-being,” from surveys collected by the World Database of Happiness (developed by the Dutch sociologist Ruut Veenhoven). Both parts of the study use data on economic development measured as GDP per capita from the World Bank’s World Development Indicators, and on inequality based on the Gini coefficient (the standard measure of inequality) from the United Nations University World Institute for Development Economics Research.
What Makes Us the Happiest About the Places We Live
Urbanites and suburbanites in the U.S. have a lot more in common than you might have guessed.
While happiness did track the level of economic development across these 16 advanced nations, the results changed when inequality was added to the equation. Higher levels of inequality led to lower levels of happiness, even in the most economically advanced nations. In fact, the researchers found that the percentage of respondents who said they were very happy was inversely correlated with income inequality (with a negative correlation of −.618).
“Every single time income inequality decreased between two time points, the percentage of ‘very happy’ responses went up," the researchers write. “And every time income inequality increased, the percentage of ‘very happy’ responses went down. In other words, although economic growth was steady and strong during this period, the evenness of the income distribution was fluctuating, and happiness was inversely related to income inequality.”
The second dataset covers happiness in 18 Latin American countries with less advanced, less developed economies, using data from the Latin American Barometer (or Latinobarómetro), an annual public survey of happiness and well-being. Here the study generated two key findings. Again the researchers found that inequality dampened happiness. But in contrast to the findings for the advanced nations, they found that happiness did not increase alongside economic growth.
When economic growth can’t buy happiness
What might explain this difference between the Latin American countries and the more advanced nations? One possibility is that the developed nations have lower levels of inequality, so that even when inequality reaches a high point, wealth is still distributed fairly evenly within a nation. Indeed, the study found that it is the even distribution of economic growth across a population that accounts for greater happiness. In contrast, when economic growth is concentrated among a small portion of a nation’s elite, it does not lead to greater life satisfaction.
The chart below shows how the 34 nations in the study compare to one another. (Income inequality is plotted on the X-axis, and the correlation between happiness and economic output is on the Y-axis.) The fitted line slopes down and toward the right, indicating a negative correlation of −.397.
The nations in the lower right-hand quadrant have high inequality and negative correlations between happiness and GDP, and include Honduras, Argentina, Costa Rica, Chile, and Paraguay. The nations in the upper left-hand quadrant have low inequality and a positive correlation between happiness and GDP, and include Scandinavian and European nations like Sweden, Finland, the Netherlands, Denmark, and France—as well as Japan.
Other studies of nations and metros have found inequality to be negatively related to economic growth. A detailed 2008 study found that more unequal metros actually had slower overall rates of growth, after controlling for education and skill levels. A recent International Monetary Fund study found that lower levels of inequality are strongly and positively associated with faster economic growth, and that a greater redistribution of wealth contributes to economic growth as well. Studies of U.S. metros have also found greater inequality to be associated with less economic growth.
My own research on 138 nations finds inequality to be negatively correlated with creative capacity and competitiveness. In fact, I find that nations can be divided into two distinct camps: a low-road camp—which includes the United States and the United Kingdom—that combines high creativity with relatively high levels of inequality, and a high-road camp—which includes countries like Sweden, Finland, Denmark, and Norway—that combines high creativity with substantially lower inequality.
“Even growth is happy growth”
According to the study, there are two basic psychological reasons why inequality can dampen happiness, even in fast-growing nations. On the one hand, as inequality rises and a small band of elites gobble up all the spoils of growth, the broad mass of people may not directly experience any benefits—a familiar scenario in today’s world. On the other, high levels of inequality cause less advantaged people to see how relatively disadvantaged they are in comparison to these elite few.
Whatever the case may be, it’s clear that economic growth alone is not a sufficient condition for happiness. Instead, it is the distribution of this increased wealth that increases our satisfaction. As the study puts it, “Even growth is happy growth, and uneven growth is unhappy growth.” If nations want their citizens to be happy, they will have to accomplish the difficult task of ensuring that their income levels are balanced and fair.
Income Inequality Makes People Unhappy
Thoughts millennials?