OfTheCross
Veteran
Those Hellcats ain't gonna pay for themselves 
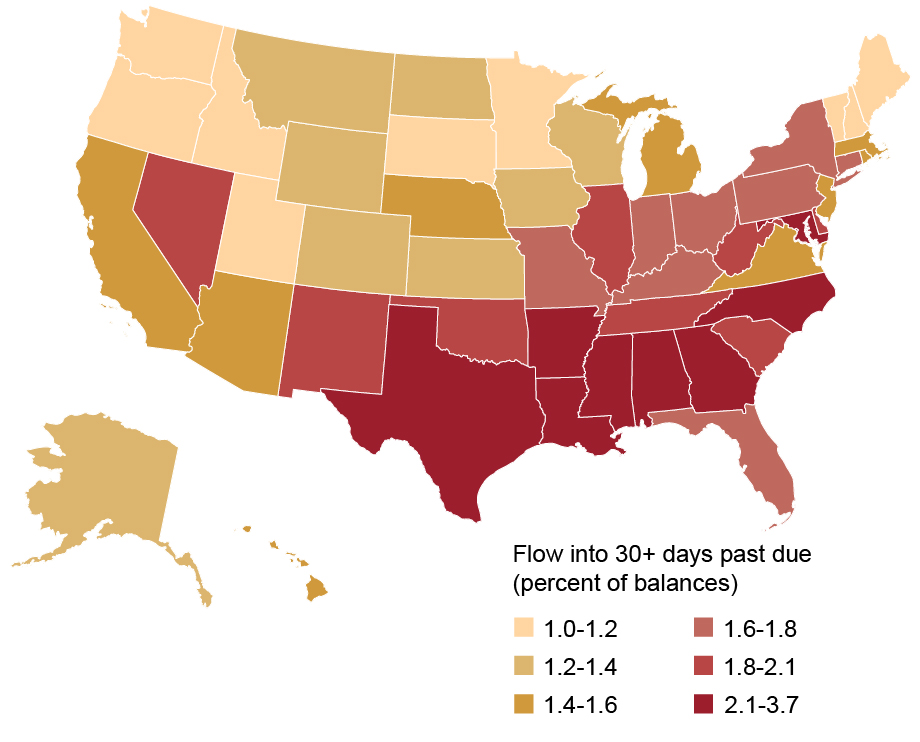
The map below depicts the current share of auto loan balances 30+ days past due, by state. There is considerable variation in the delinquency rates by state, mostly reflecting differences in borrower composition and in local economic conditions. Notably, a map of the delinquency transition rates from the fourth quarter of 2019 would yield a nearly identical picture: the rankings of the states in this map are hardly changed from their ranks before the pandemic.
Auto Loan Delinquency Concentrated in the South


An overall wonderful article, though. Poor people are going delinquent a bit, but not any more than usual.
The rise in mortgages and car prices really drove up household debt, though.

The map below depicts the current share of auto loan balances 30+ days past due, by state. There is considerable variation in the delinquency rates by state, mostly reflecting differences in borrower composition and in local economic conditions. Notably, a map of the delinquency transition rates from the fourth quarter of 2019 would yield a nearly identical picture: the rankings of the states in this map are hardly changed from their ranks before the pandemic.
Auto Loan Delinquency Concentrated in the South


Historically Low Delinquency Rates Coming to an End - Liberty Street Economics
Total household debt increased by $312 billion during the second quarter of 2022, and balances are now more than $2 trillion higher than they were in the fourth quarter of 2019, just before the COVID-19 pandemic recession, according to the Quarterly Report on Household Debt and Credit from the...
libertystreeteconomics.newyorkfed.org
An overall wonderful article, though. Poor people are going delinquent a bit, but not any more than usual.
The rise in mortgages and car prices really drove up household debt, though.